Eight Essential Charts and Maps From NYC DOT’s New Mobility Report
NYC DOT released its citywide Mobility Report today, and the topline numbers scream for congestion pricing and the rapid implementation of NYCT chief Andy Byford’s Fast Forward transit plan.
The big picture has grown more alarming since DOT released its last Mobility Report in 2016. Despite rising population, employment, and tourism, subway and bus ridership both fell in 2017. Meanwhile, propelled by the growth of ride-hailing trips, congestion continues to intensify. New York is a growing city where transit ridership is shrinking and streets are choking on car traffic.
To handle the rising number of residents, jobs, and tourists, New York needs a functional transit system, good walking and biking networks, and intentional policies to keep motor vehicle traffic in check. The major indicators in this report signal the failure of Andrew Cuomo and Bill de Blasio to prepare for and respond to this growth.
The trend movements in DOT’s graphics may appear subtle, but they’re showing what New Yorkers feel viscerally on delayed subways and buses stuck in traffic. The city’s transportation network isn’t working the way it should.
Here are the growth trends:
And here are the transit ridership trends:
One transportation sector that is experiencing growth is cars for-hire. Echoing the more detailed work of Bruce Schaller, DOT reports that while yellow cab trips are falling, the growth of trips via Uber, Lyft, and their peers substantially outweighs that decline.
That is one indisputable reason why streets are growing more clogged and congested in Manhattan below 60th Street, according to taxi GPS data:
New to this year’s Mobility Report is a citywide travel survey and trip diary with responses from thousands of New Yorkers. Among the findings: More respondents said their ride-hail trips were substituting for transit than for yellow cabs.
With the Second Avenue Subway debuting at the beginning of 2017, the Upper East Side was the site of some rare positive trends. Most Second Avenue Subway riders — 82 percent — switched from the Lexington line, according to DOT surveys, relieving pressure on the city’s most crowded subways. About 2 percent switched from yellow cabs. But a small percentage of subway riders translates to a large share of cab trips. Taxi trips on the Upper East Side fell substantially faster than the citywide decline after the Second Avenue Subway launched:
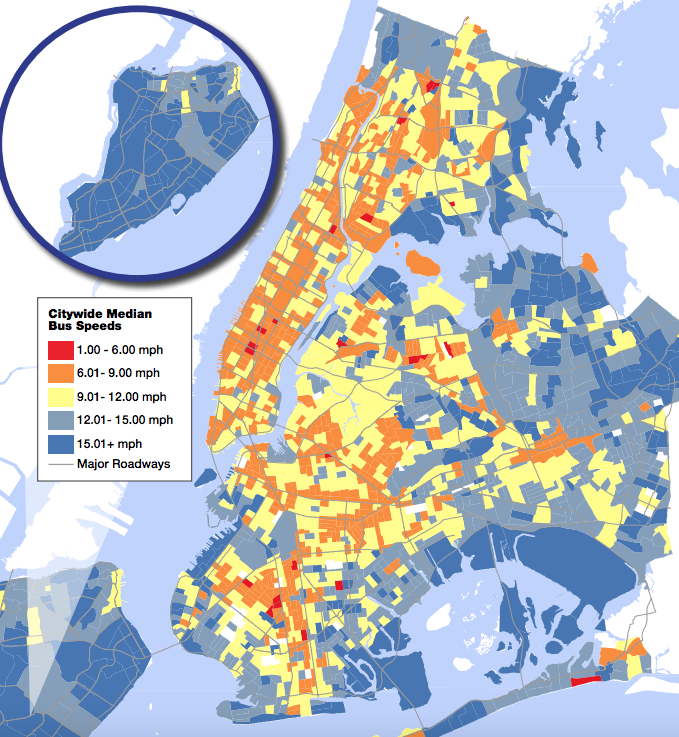
Average traffic speeds are also ticking upward on Upper East Side avenues, bucking the trend elsewhere in Manhattan. This shows up on DOT’s map of changes in bus speeds citywide from 2015 to 2017, where the Upper East Side looks bluer than the rest of the city:
The big addition to the report is the travel survey, which could provide more detailed and up-to-date information on how New Yorkers get around than the Census or National Household Travel Survey. DOT collected a 40-question survey from a statistically valid sample of residents in 10 zones of the city, gathering information on primary travel mode, car-share trips, parking usage, and other transportation habits. The report summarizes the responses in a few pages — Streetsblog has requested the full set of crosstabs from DOT.
In all 10 zones except Staten Island, people get around without a private car for most of their trips.
New York’s transportation policies should build on these strengths. But as long as the subways and buses remain in decline, that’s not possible.

Read More:
Streetsblog has migrated to a new comment system. New commenters can register directly in the comments section of any article. Returning commenters: your previous comments and display name have been preserved, but you'll need to reclaim your account by clicking "Forgot your password?" on the sign-in form, entering your email, and following the verification link to set a new password — this is required because passwords could not be carried over during the migration. For questions, contact tips@streetsblog.org.