With New York City's population swelling to a record size, subways and bikes now account for about 700,000 more trips each day than 16 years ago, according to a new report from NYC DOT [PDF]. Car trips into the Manhattan core, meanwhile, are declining, but so is citywide bus ridership.
DOT's "New York City Mobility Report" follows in the footsteps of the Bloomberg-era "Sustainable Streets Index" -- an annual update on city transportation trends. After skipping two years, DOT is out with its first edition of the report under Commissioner Polly Trottenberg, adding some interesting data.
The stats are a testament to the importance of transit and bicycling to New York's ability to welcome more people and sustain more economic activity. They're also sobering. What happens if the subways and streets can no longer keep up with the city's growth? And why are New Yorkers abandoning the bus?
Ridership is straining the limits of several subway lines, with crowding a frequent source of delays. But capital improvements to increase subway capacity take too long to complete, cost too much, and are backed by a mountain of debt. (Don't worry, Governor Cuomo's got this -- Wi-Fi and USB ports are on the way.)
The subways are, by and large, beyond the city's control. But NYC DOT does control the streets, and while the Mobility Report isn't prescriptive, if you read between the lines the implications are pretty clear.
Using location data from Citi Bike and yellow taxis, DOT reports that it is now faster to bike in Midtown Manhattan than to drive. Bike-share trips that start and end in Midtown are at least 2 mph faster than comparable cab trips between 8 a.m. and 6 p.m. The city may not be able to enact a congestion-busting plan like Move NY on its own, but it can help people beat car congestion by providing safe routes for bicycling.
The major new analysis in the report uses real-time bus location data from MTA BusTime to calculate bus speeds throughout the city. The result is this map, which as far as I know is the first of its kind:
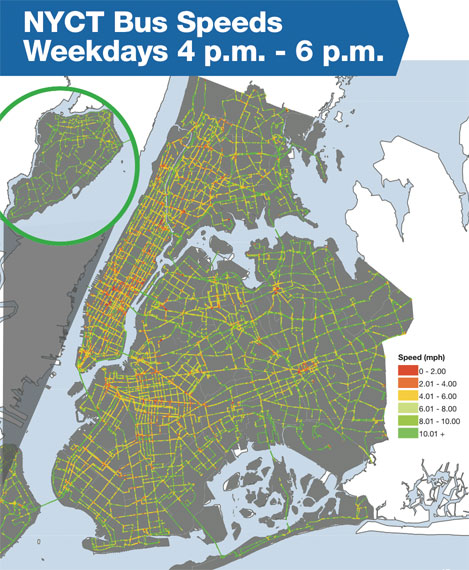
The red zones are where bus routes are most in need of a speed boost. In addition to steps like off-board fare collection and bus lanes that DOT and the MTA are rolling out route-by-route, the map suggests that on-street parking reform could have a significant impact on bus speeds.
As DOT notes, bus routes are "slowest in commercial districts like Midtown Manhattan, Downtown Brooklyn, and Jamaica Queens." Many of those districts are where parking placard abuse is most rampant or meters are most underpriced relative to demand, so buses get by slowed down by double-parked cars and motorists circling for cheap spots to park. No progress has been made on the placard front or the pricing front in years.
The trend in bus ridership suggests the city and the MTA need to ramp up their efforts to improve service. Five years after a major round of service cuts, New Yorkers continue to make fewer bus trips. Bus ridership fell 2 percent in 2015 compared to the previous year, and has dropped nearly 7 percent since 2010. In that five-year span, citywide bus speeds have fallen 2 percent.
Other major points of note from the report:
- A mystery of Manhattan traffic is that vehicle speeds have slowed even though fewer cars are entering the city core. The report reiterates that fact without offering an explanation. (One hypothesis, that Uber and other for-hire services are generating more traffic in central Manhattan, was neither proven nor disproven by a City Hall-funded study earlier this year.)
- From 2010 to 2015, the number of car registrations in the city rose by 112,000, but the population-adjusted car ownership rate held steady at .22 cars per person.
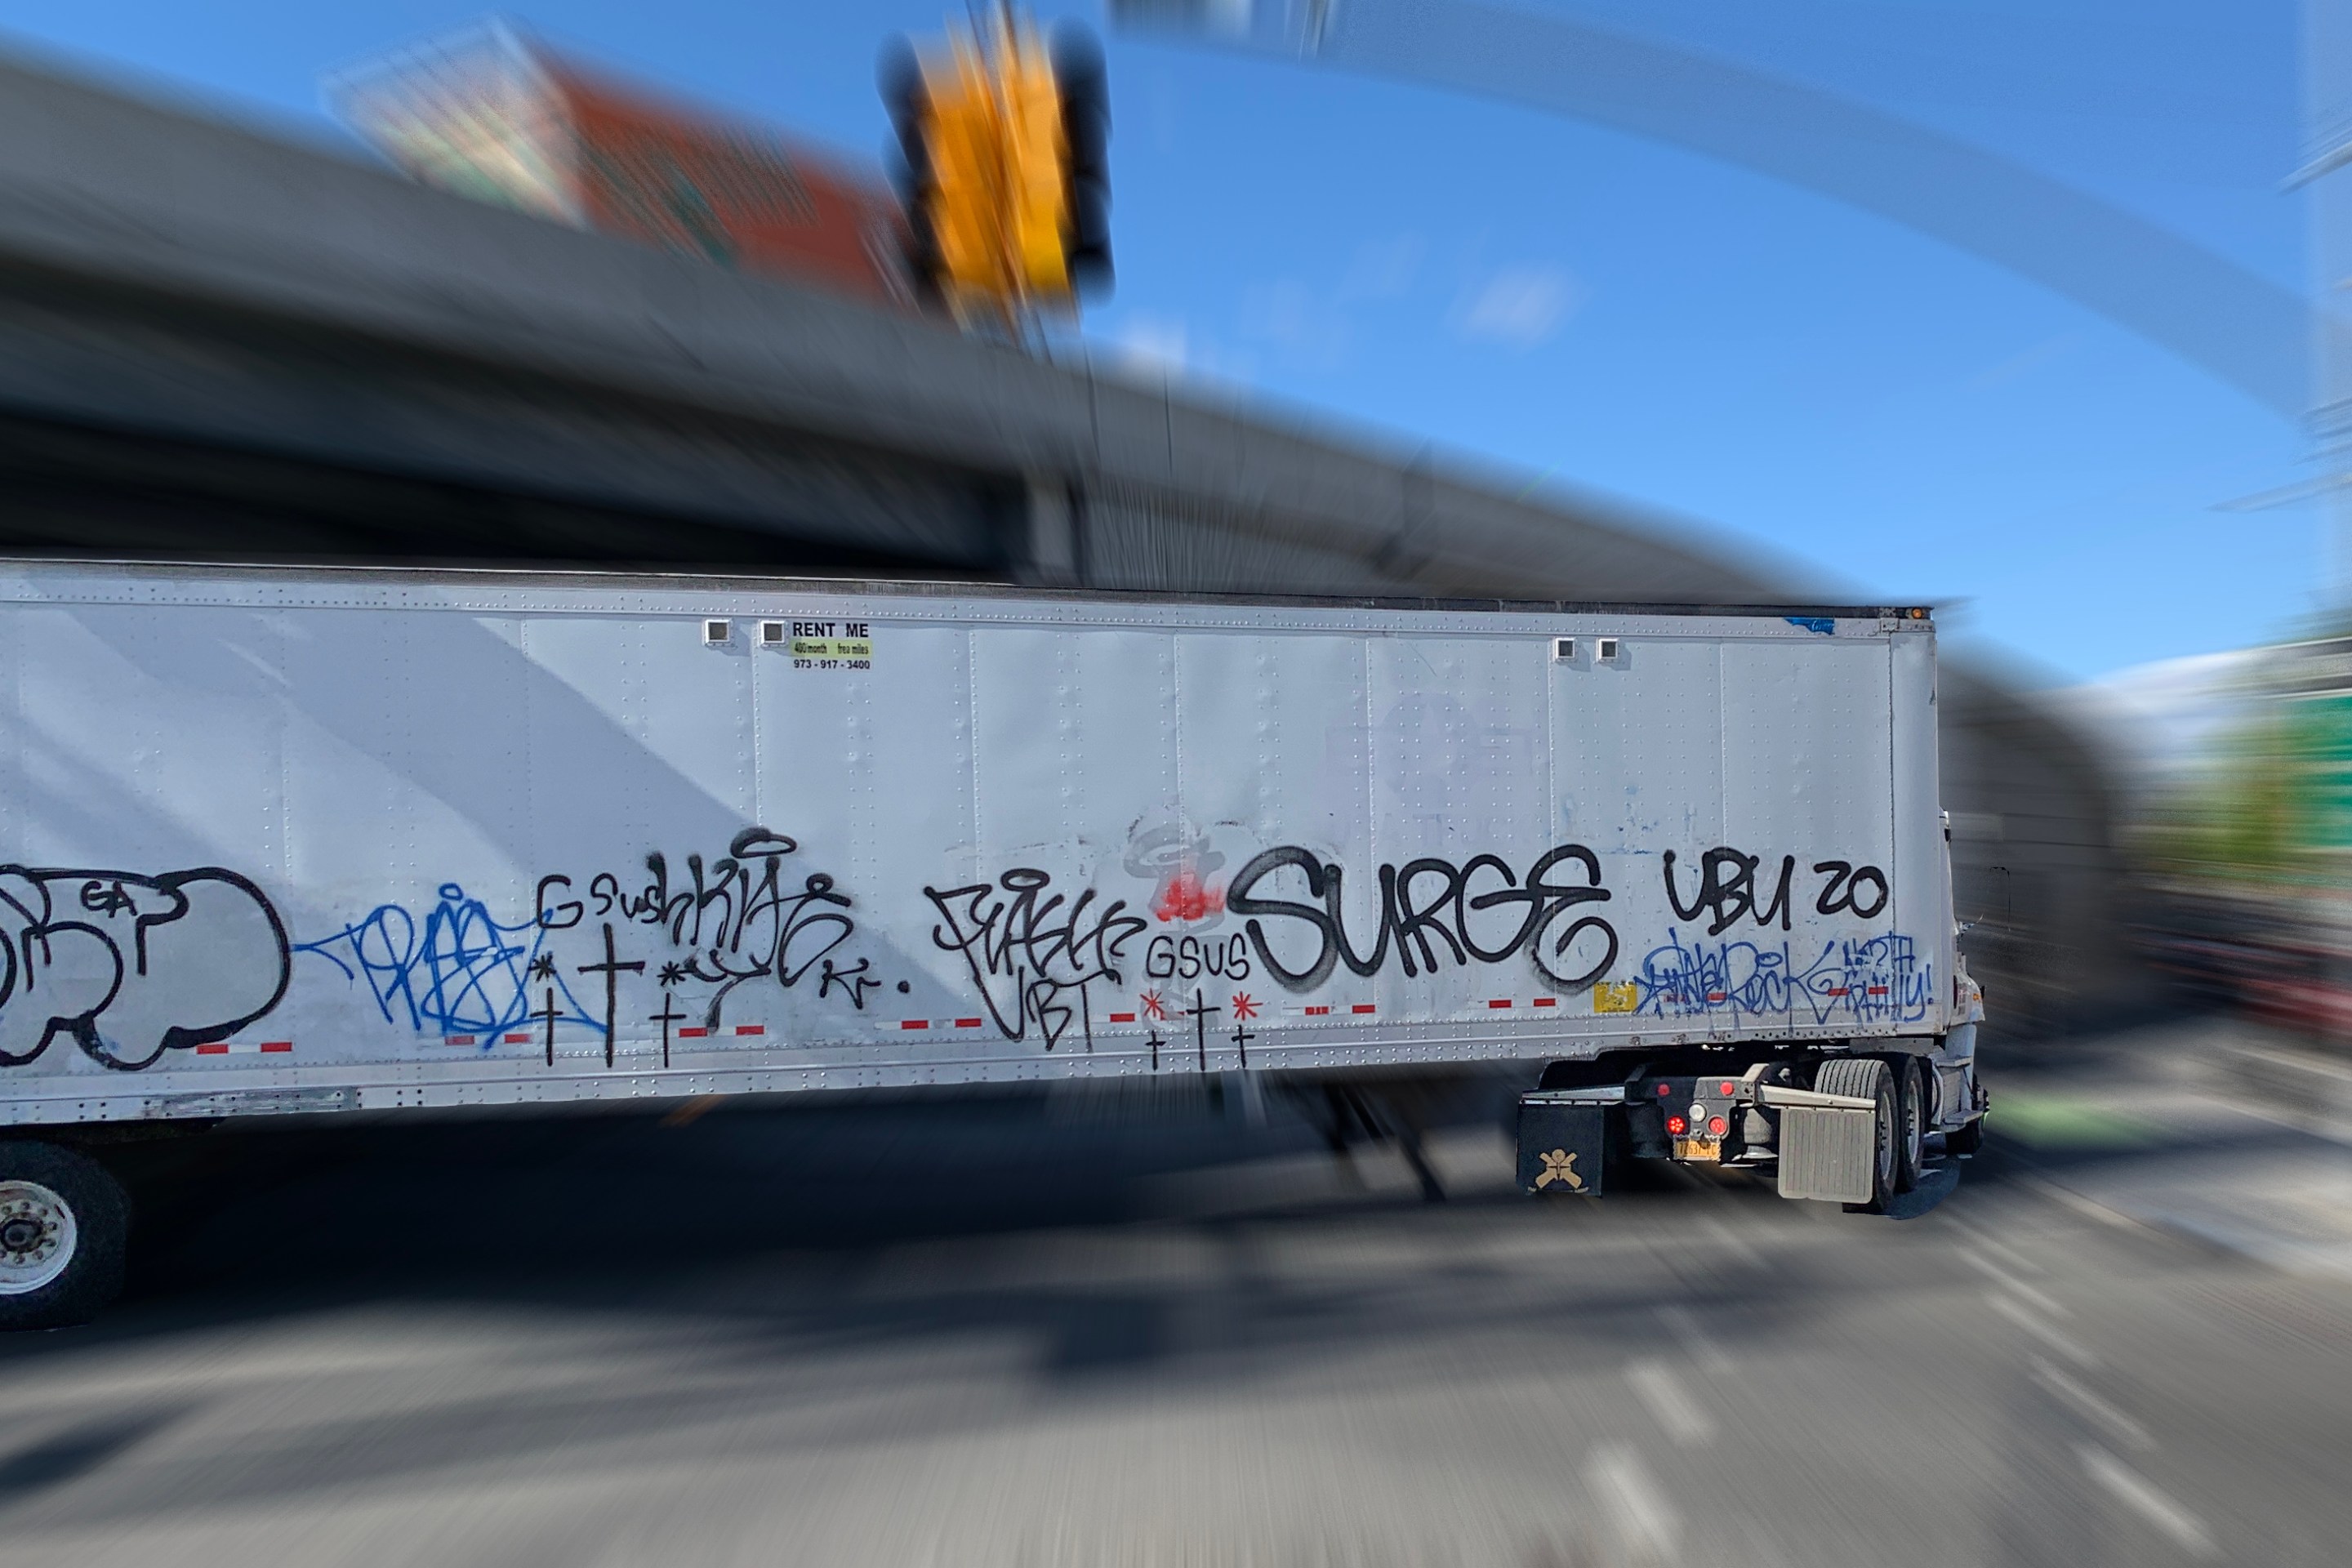
- Truck traffic is rising as the city grows, with freight trips increasing 5.7 percent from 2010 to 2013.
Streetsblog recently spoke to DOT Deputy Commissioner Ryan Russo about the report and what it tells us. Stay tuned for highlights from the interview.
Stay in touch
Sign up for our free newsletter
More from Streetsblog New York City
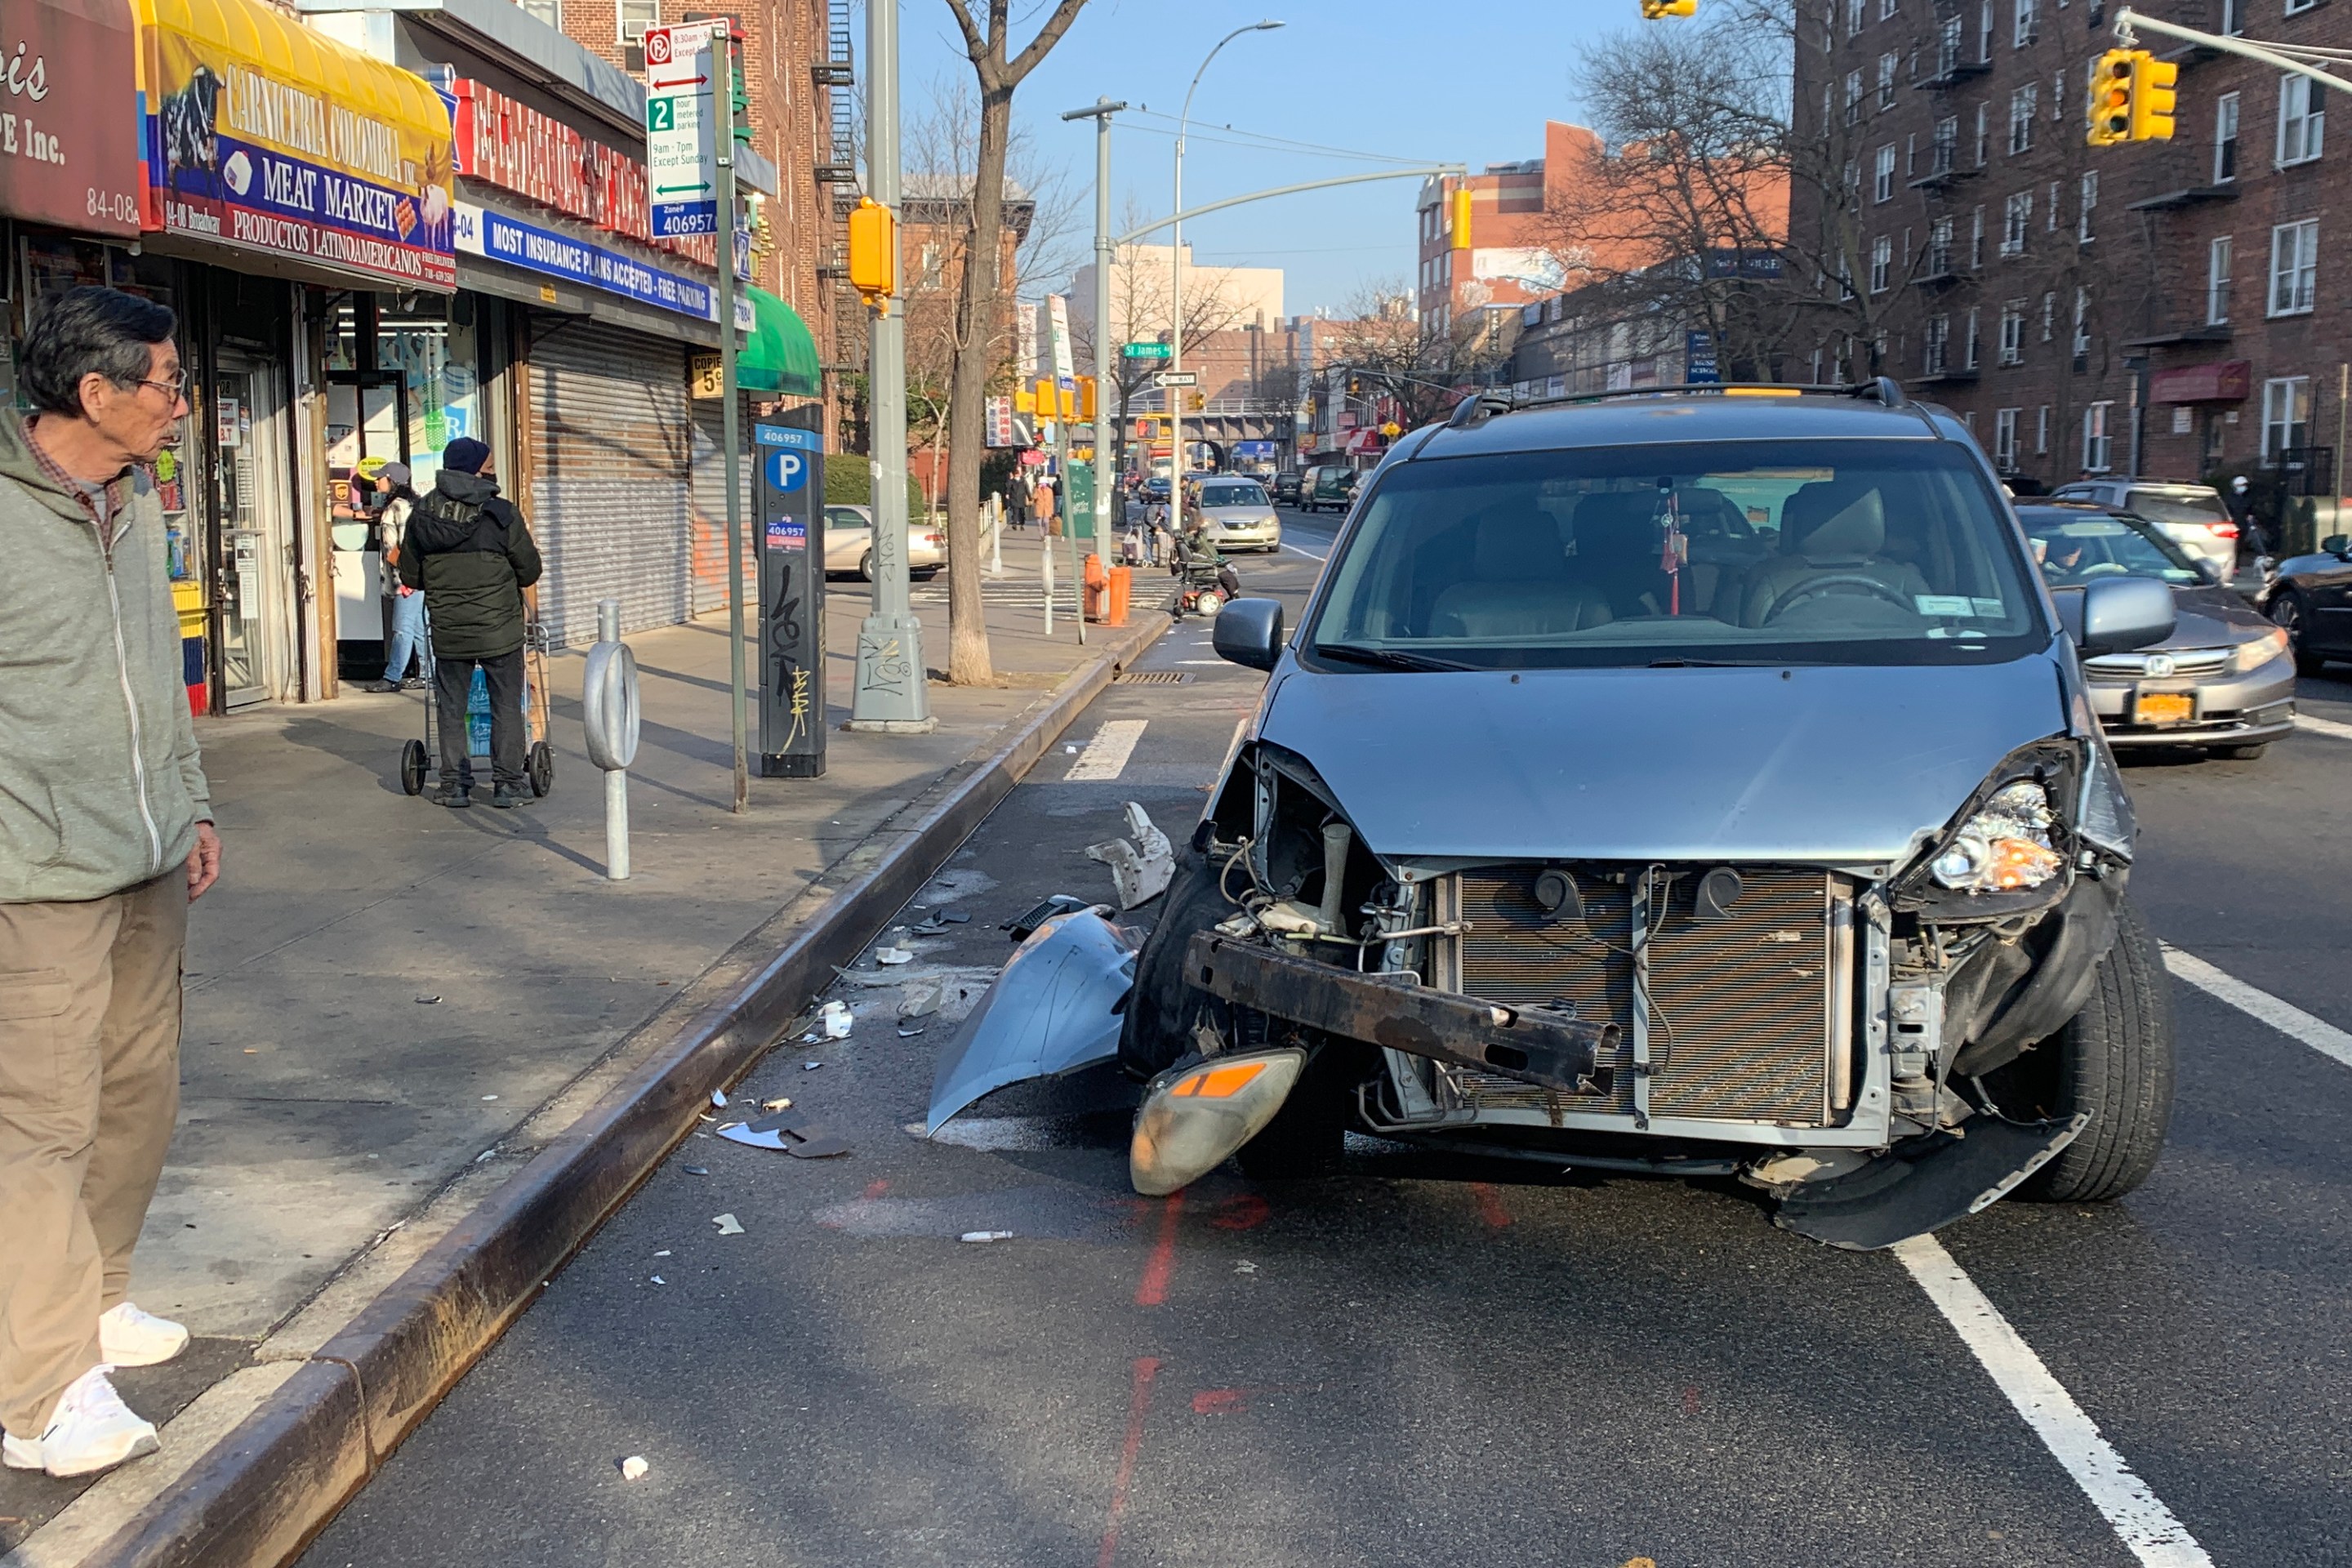
Report: Road Violence Hits Record in First Quarter of 2024
Sixty people died in the first three months of the year, 50 percent more than the first quarter of 2018, which was the safest opening three months of any Vision Zero year.
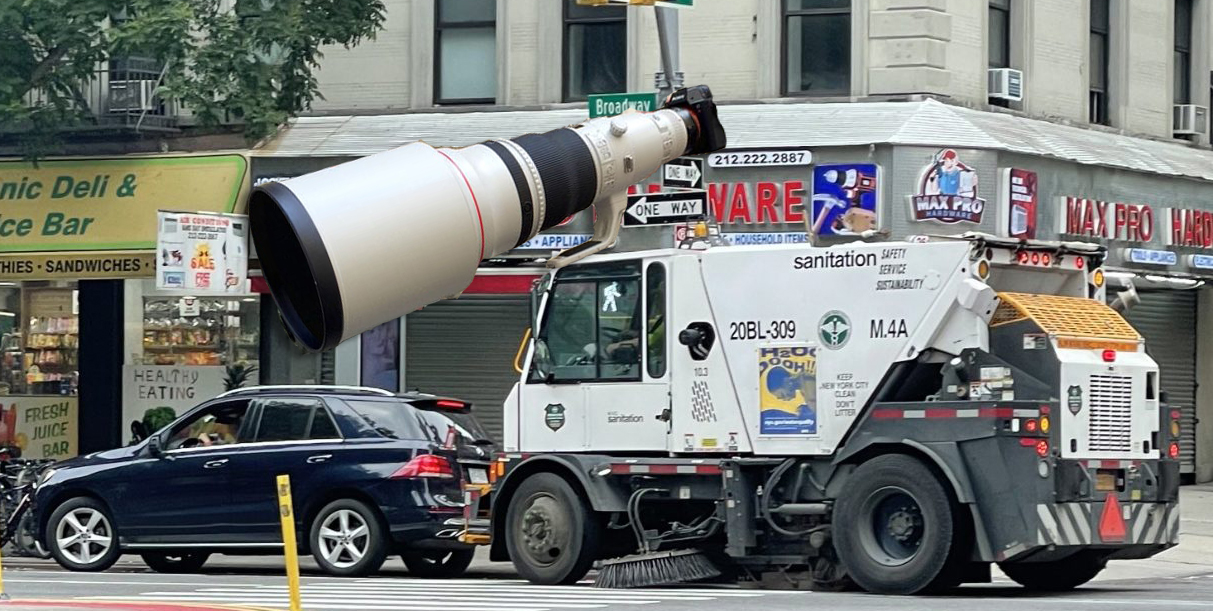
Street Sweepers Could Nab Illegal Parking Under State Bill
Smile for the street-sweeper!
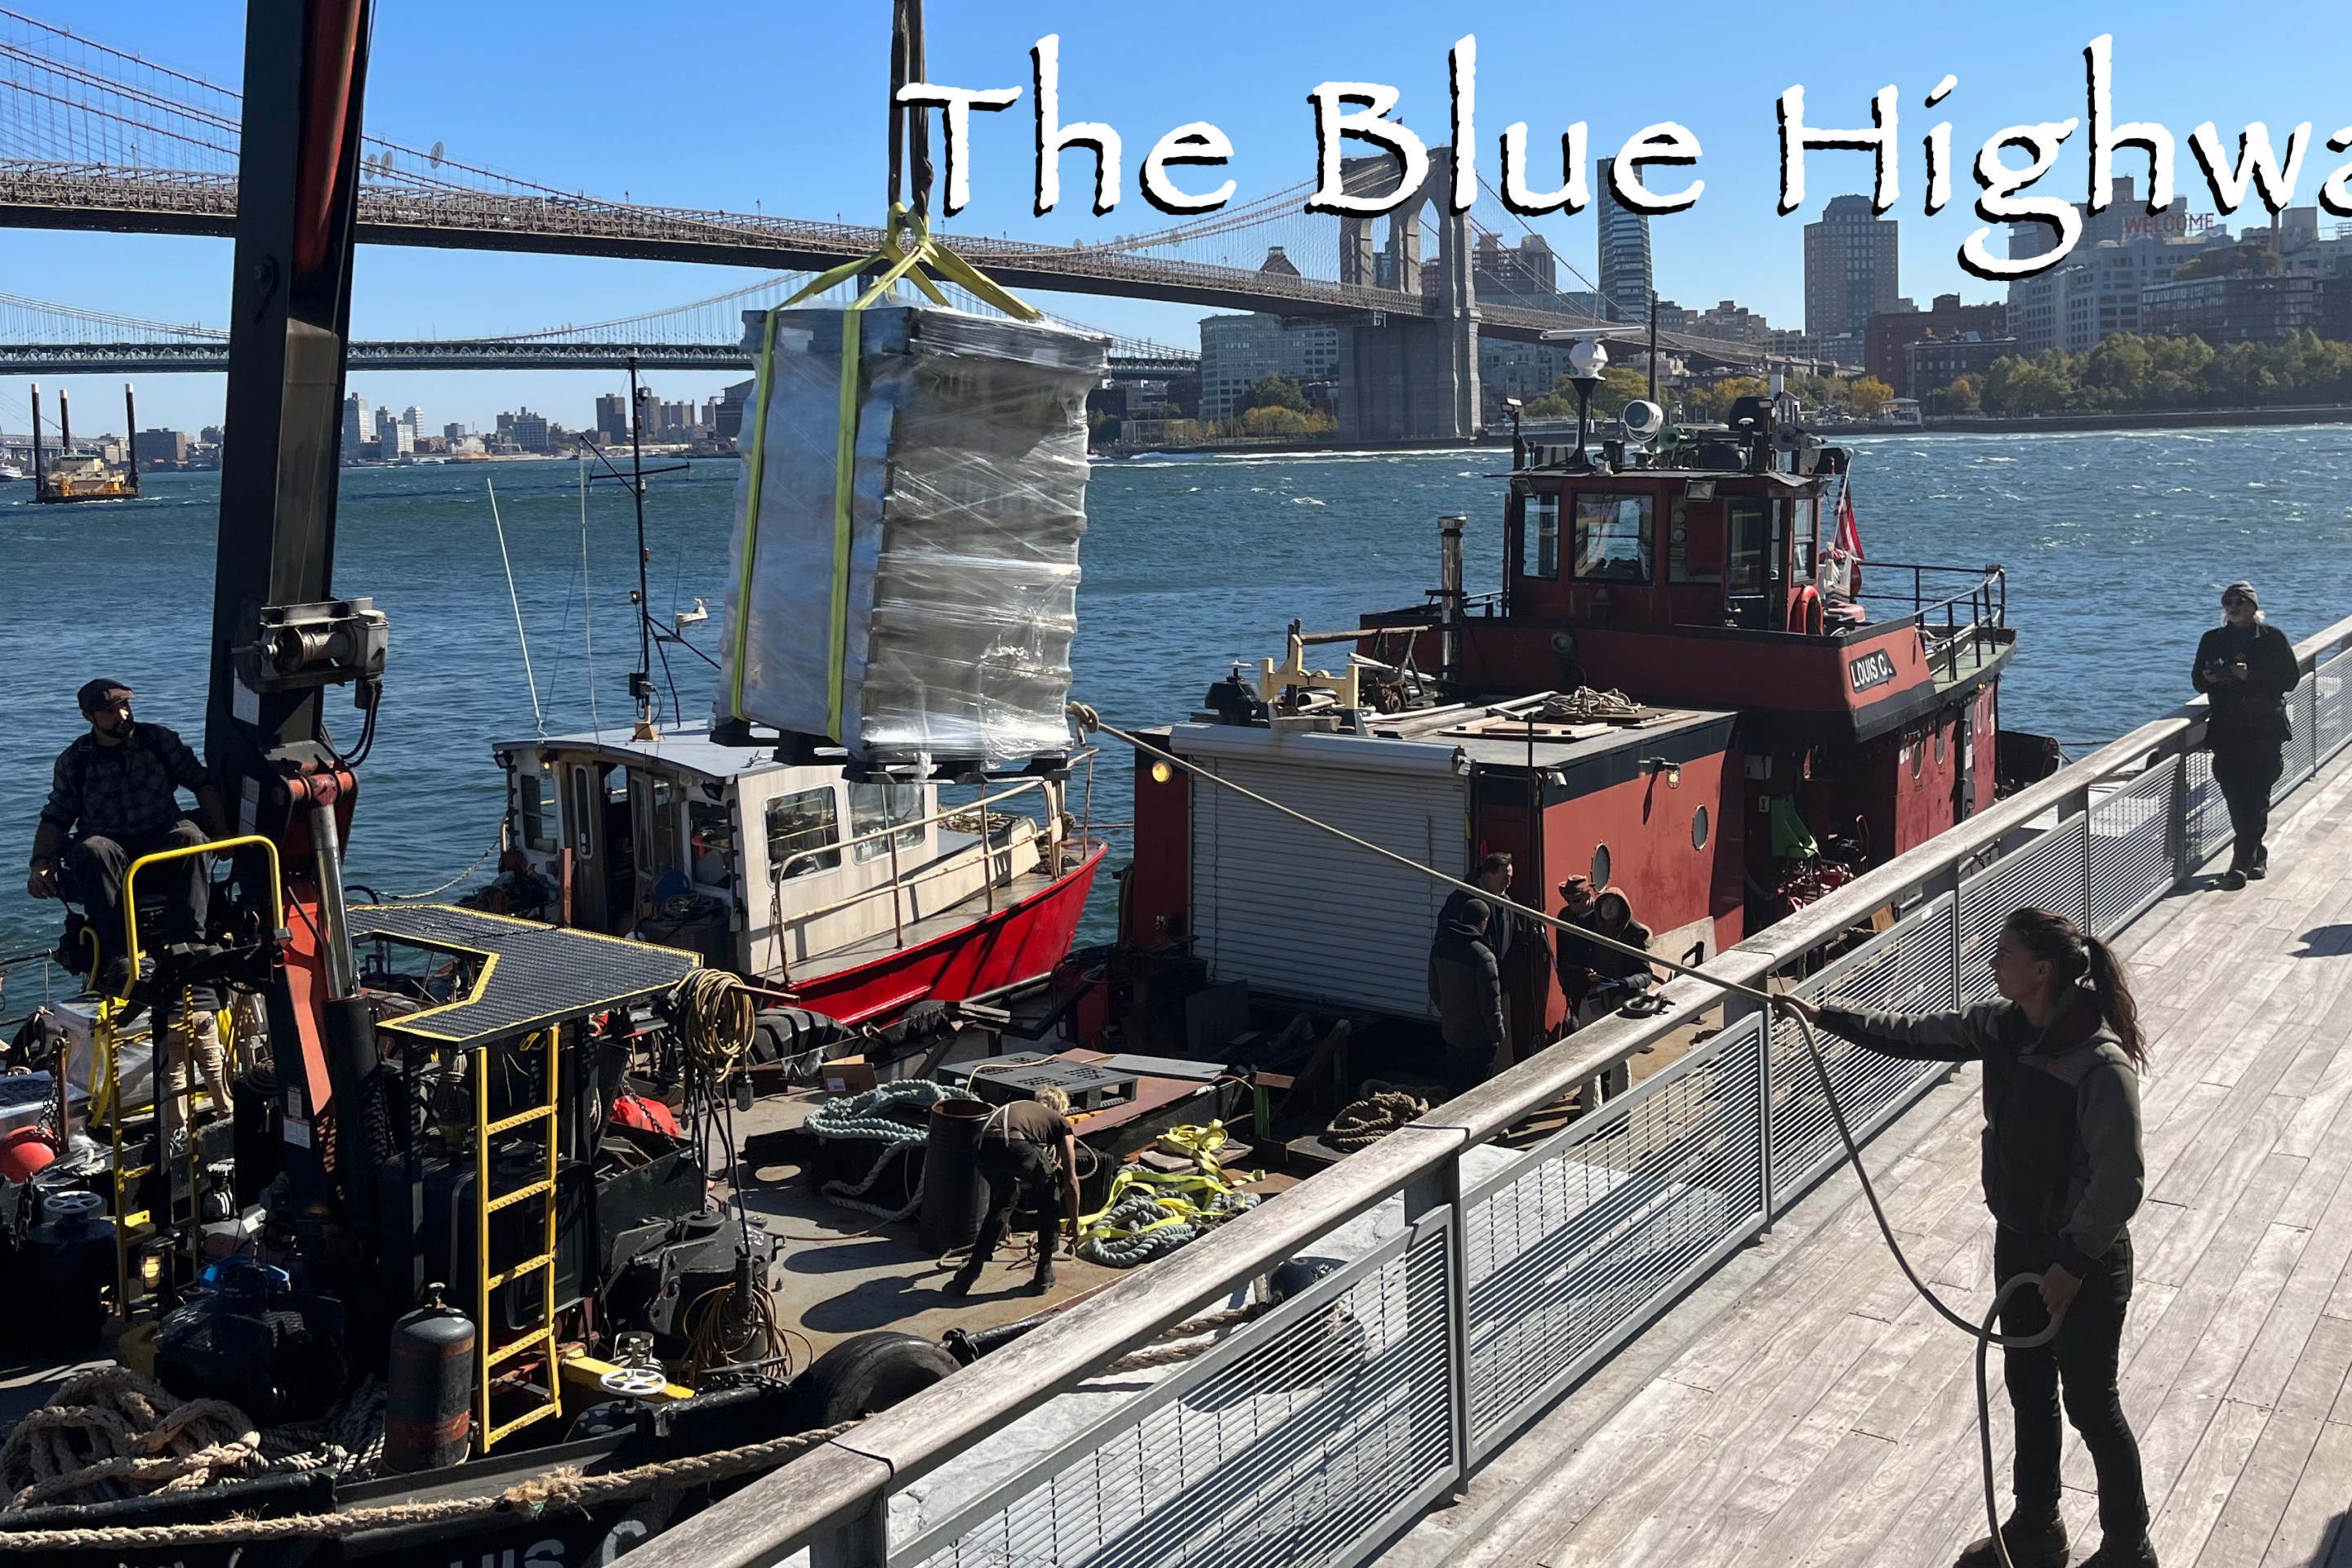
Thursday’s Headlines: The Way of Water Edition
The "Blue Highways" campaign wants the mayor to convert a downtown heliport into a freight delivery hub. Plus more news.
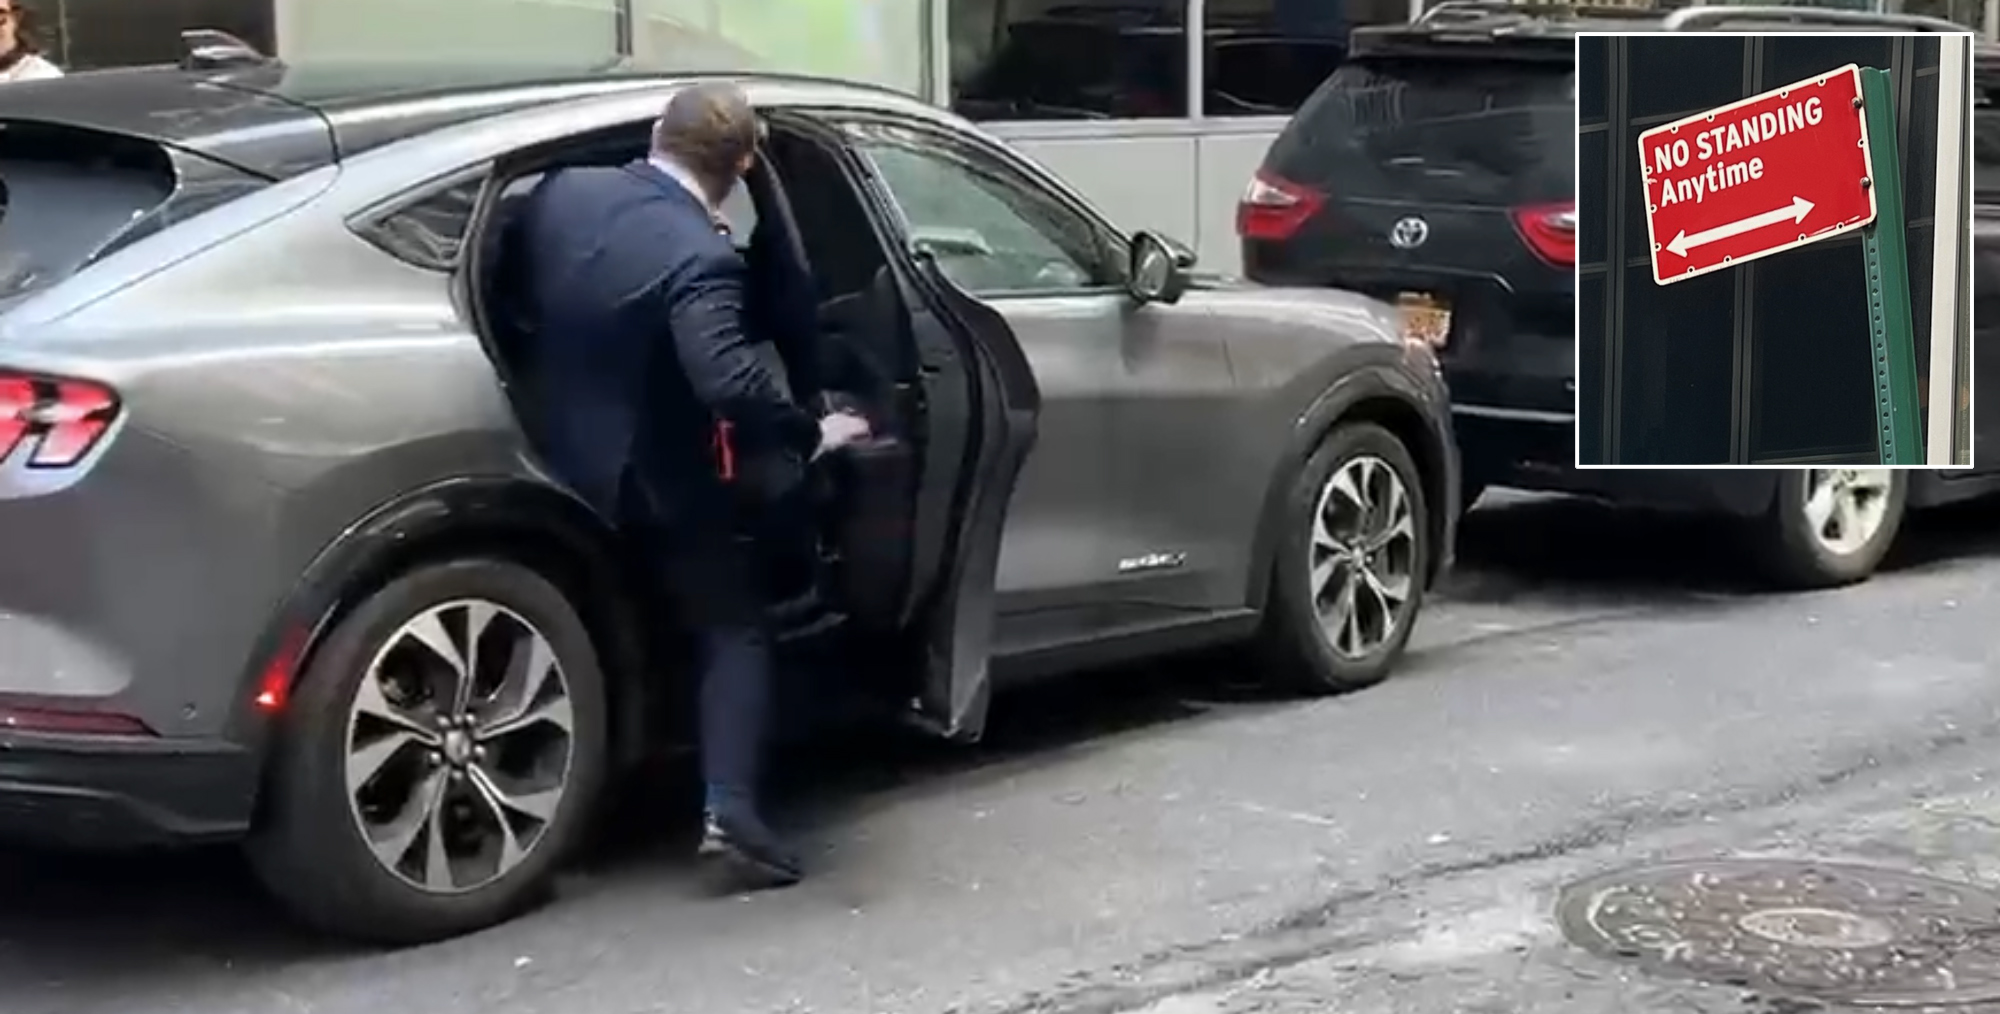
Gotcha-Heimer! Anti-Congestion Pricing Jersey Rep. With a City Speeding Ticket Drove to Manhattan on Wednesday
New Jersey's most vociferous opponent of congestion pricing parked illegally and once got a speeding ticket.