Data
Top Categories
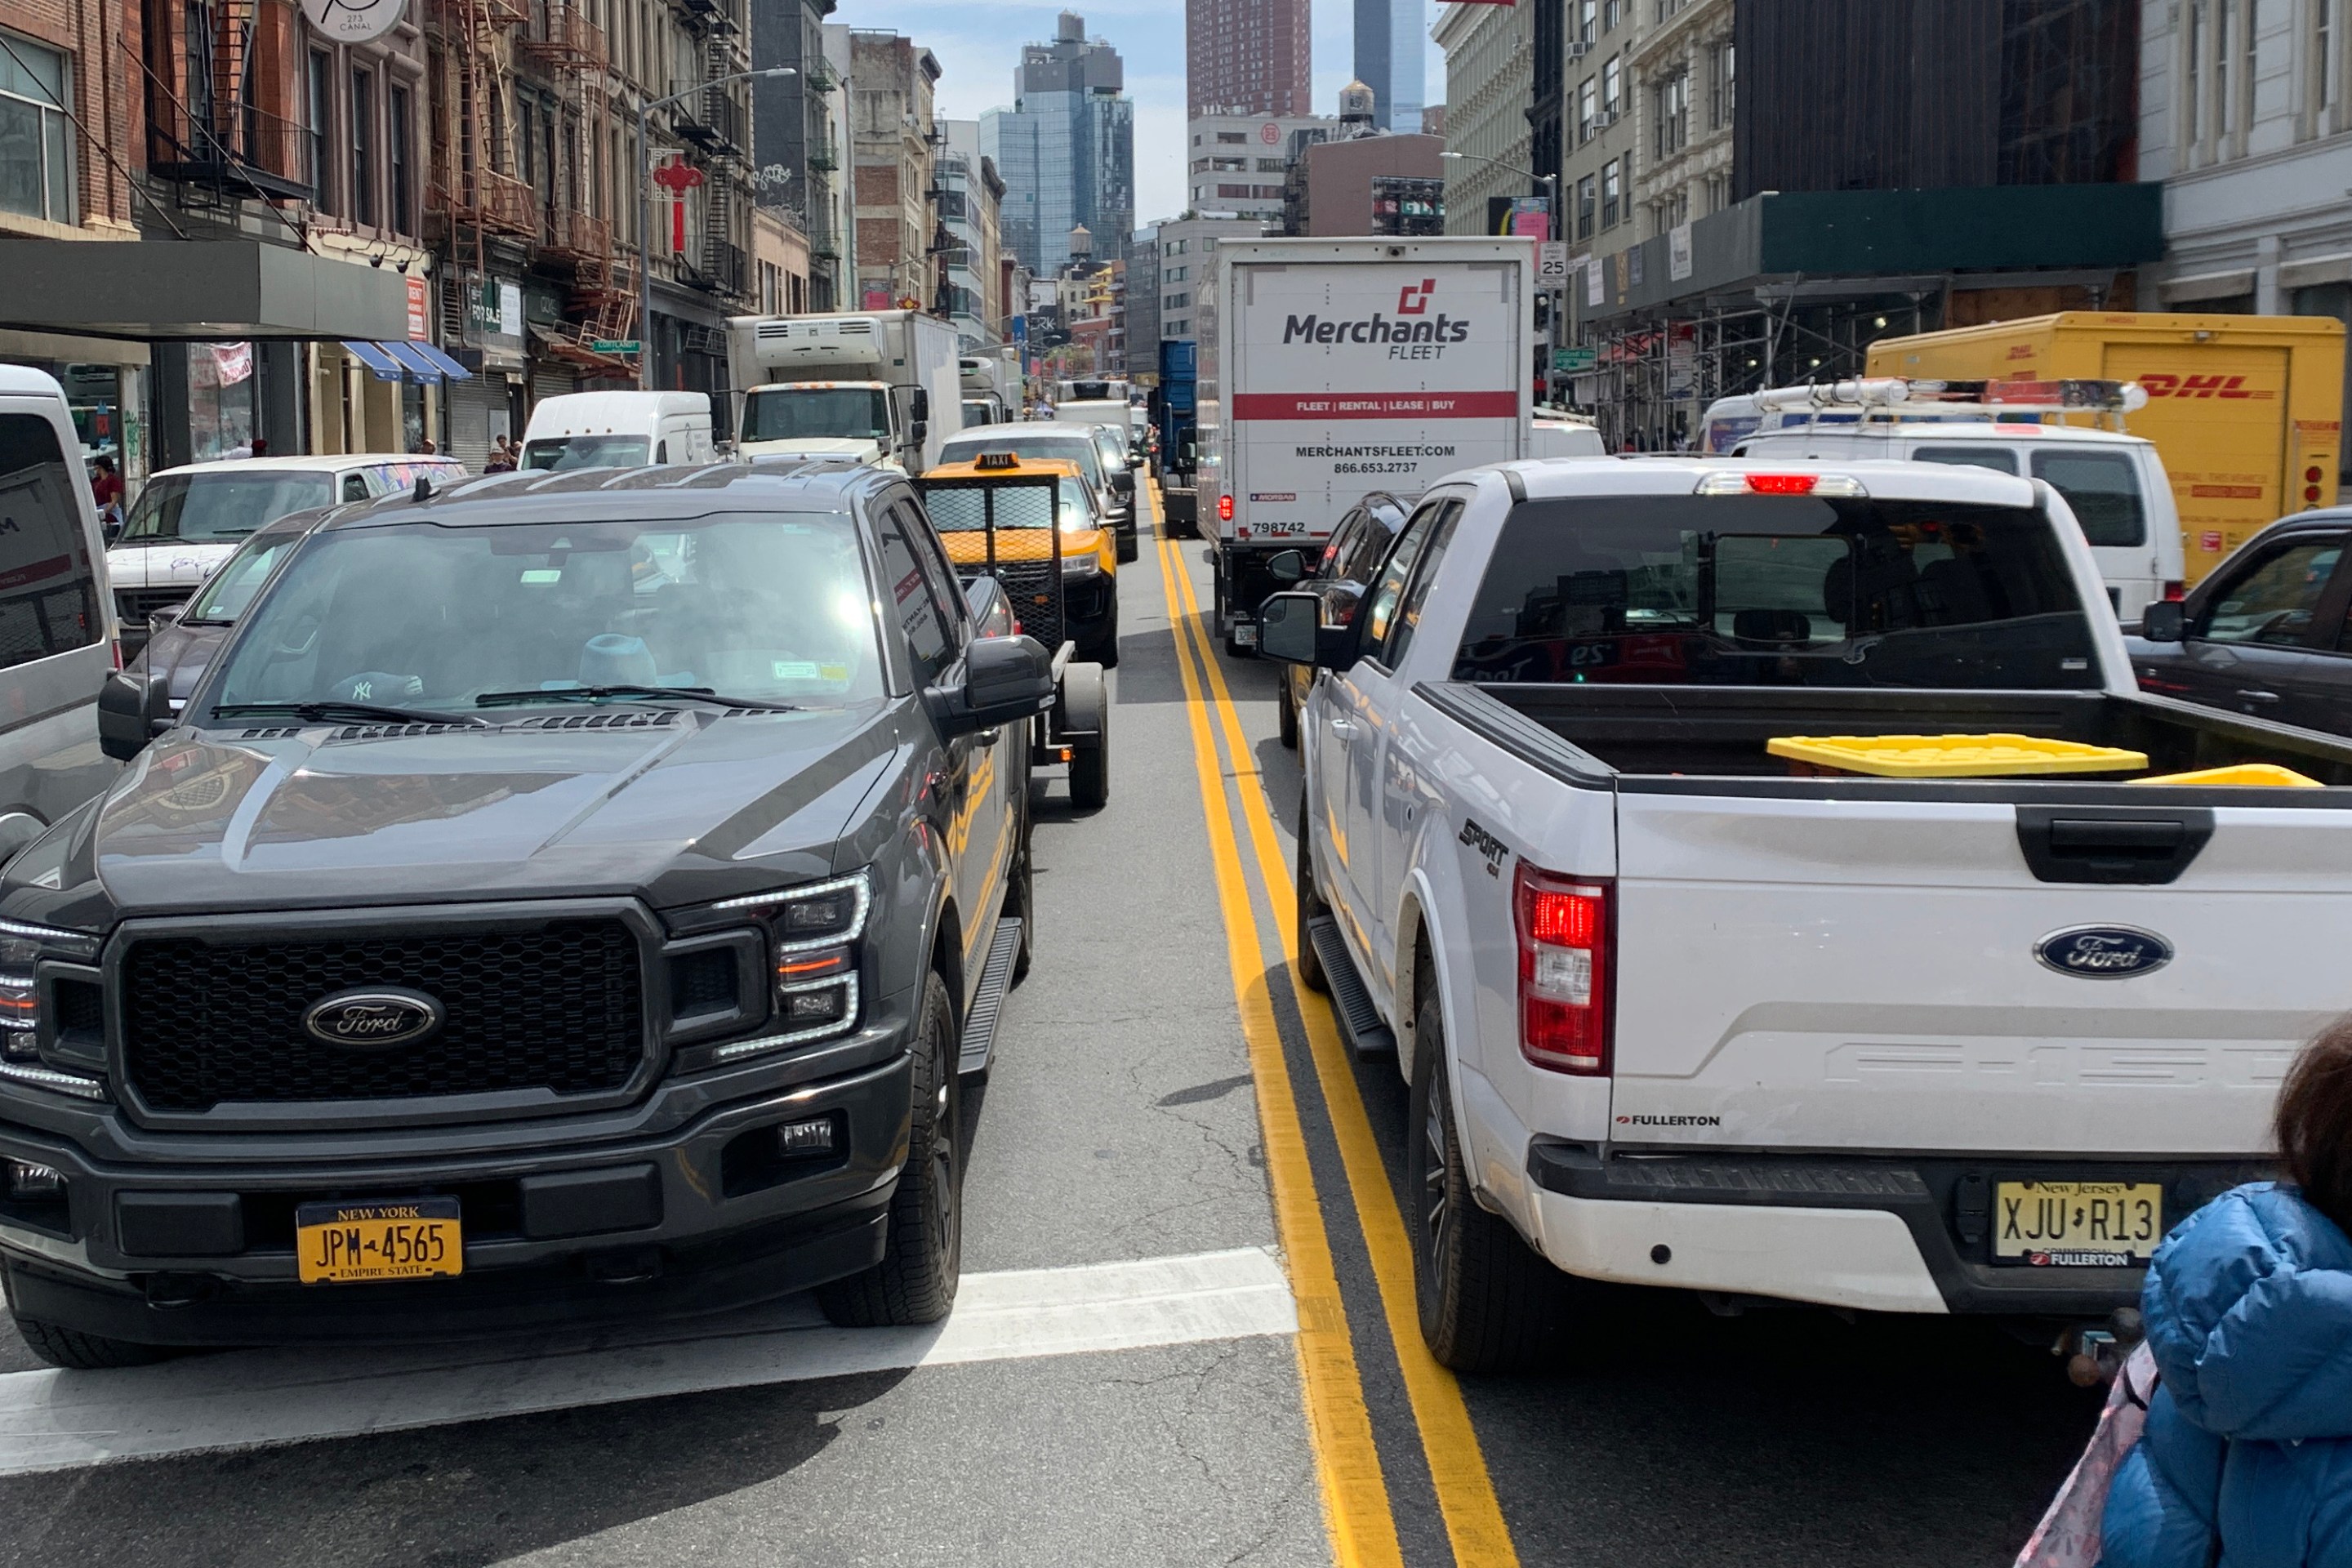
IT’S WORKING: Initial Data Show Congestion Pricing Has Stemmed The Tide of Years of Increasing Traffic
Travel times are down an average of 34 percent across the eight bridges and tunnels into the Central Business District, which saw a 7.5-percent drop in overall traffic, according to MTA figures.

Carmageddon: Shift to Remote Work Led to Increase in Driving and Congestion Nationally
Driving miles are higher today than they were before the pandemic, even though more Americans than ever still work from home.

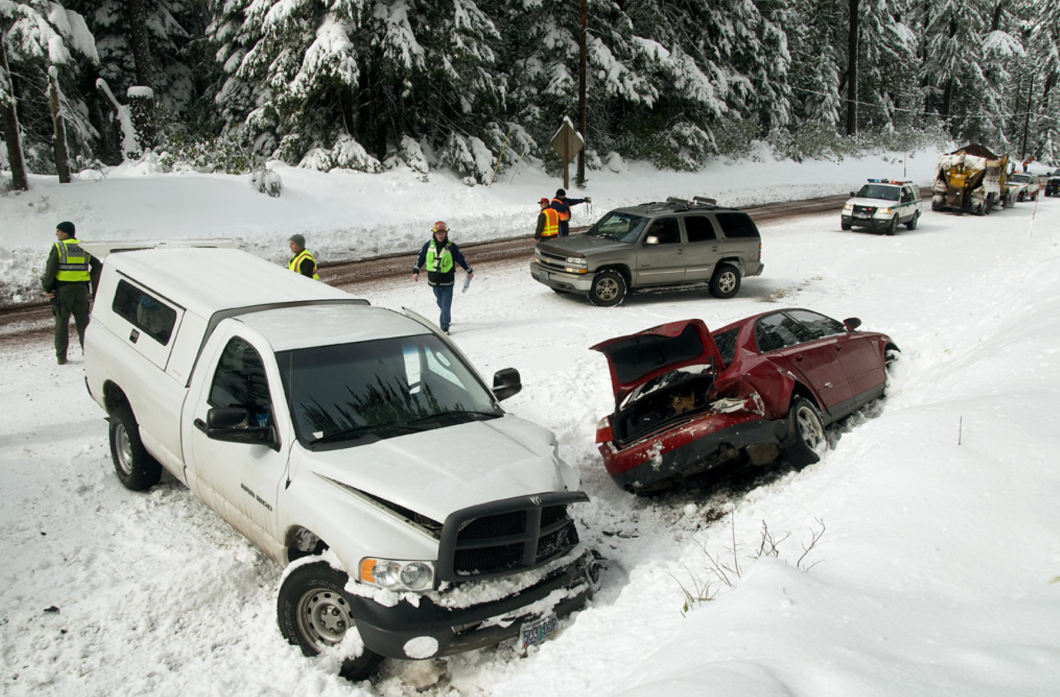
Huge Grant: Feds Send City $12M to Improve Post-Crash Analyses
Advocates have been seeking this for years: a single repository where the disparate findings from multiple agencies about road crashes will be stored and analyzed.

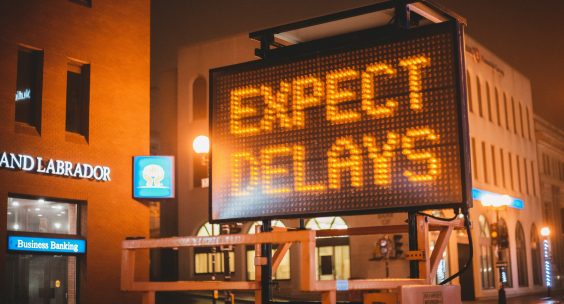
Tuesday’s Headlines: Congestion Continues Unabated Edition
New York City is the country's most congested, according to INRIX. Plus more news.
SEE IT: How Much (Or How Little) Driving is Going on in America’s Top Metros
Check it out: The lowest-mileage region isn't the one you'd think.
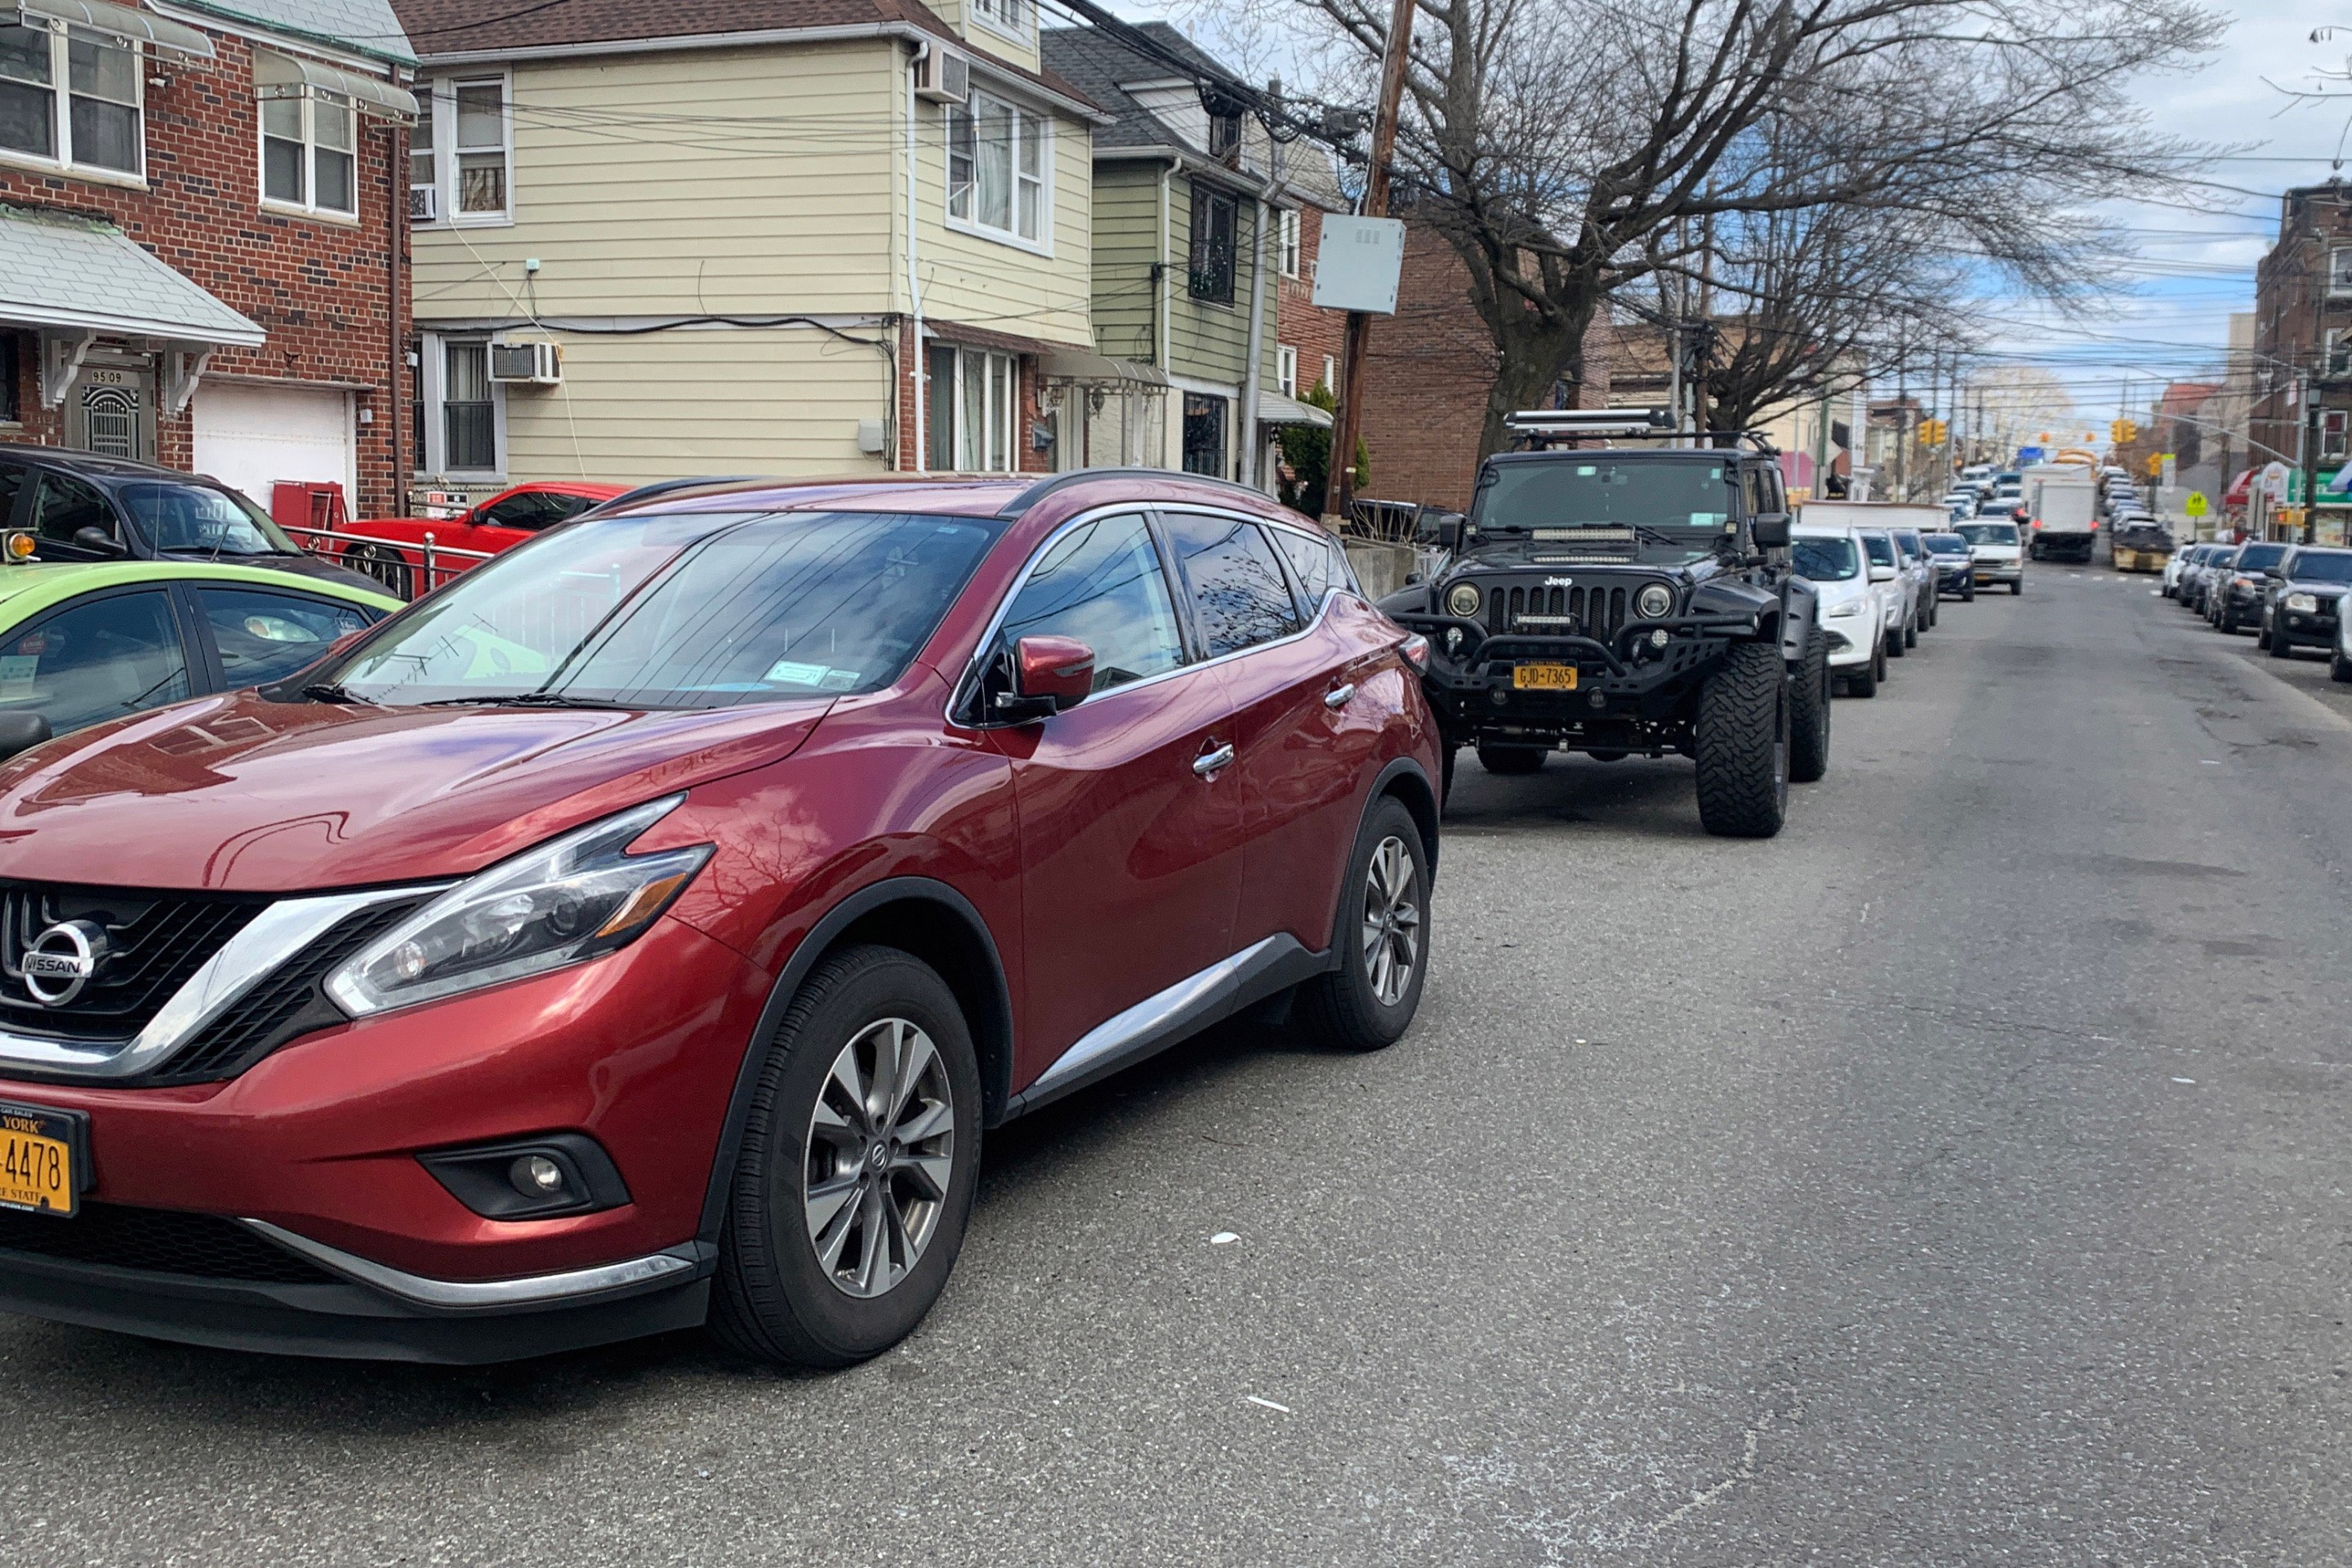
‘Cheaper than a Garage’: Meet the Drivers Who Get Repeat Tickets for Not Moving Their Cars
Alternate-side-parking tickets make up one-in-five parking summonses! And 77 percent go to repeat offenders.
Beyond ‘KSI’: How DOT Can Identify Unsafe Streets Before Tragedy Strikes
DOT guides its work using a stat based on the total number of people killed or severely injured at any given location — “KSI.” Is there a better way to gauge the safety needs of a particular street?