KOMANOFF: Data Show South Bronx Isn’t Seeing Increased Traffic from Congestion Pricing

Breaking news analysis! We now have empirical evidence to dispel last year’s widespread speculation that congestion pricing would worsen congestion and pollution in the southernmost section of the Bronx.
It has not, the data show.
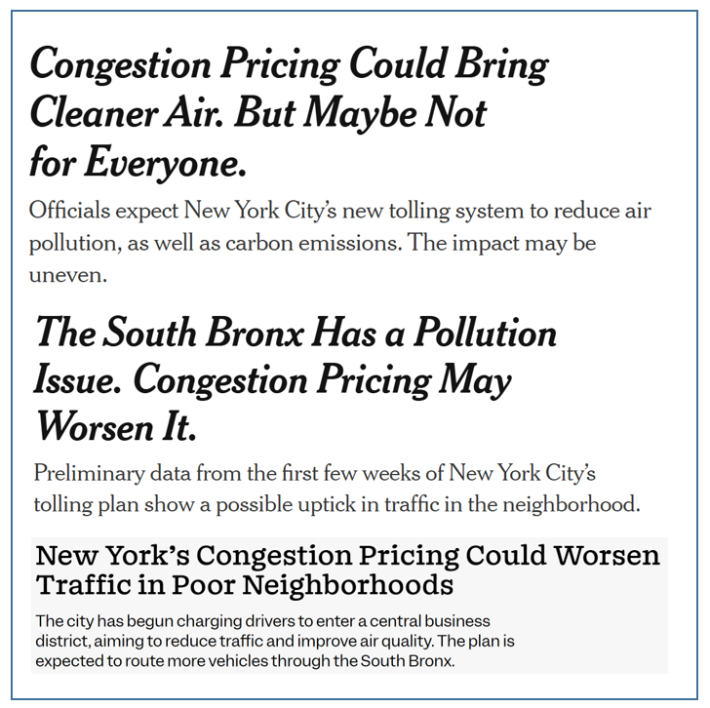
You remember the dire predictions, of course: During 2024 and even after congestion pricing’s launch in early January, 2025, some environmental groups warned of increased traffic and higher emissions in the southernmost Bronx. The New York Times covered it. So did the environmental news source Inside Climate News.
But even before then, “Gridlock” Sam Schwartz and I were positing how congestion pricing could just as easily alleviate traffic not just in Mott Haven and Port Morris, but throughout the Bronx. Some truck journeys that previously detoured around Manhattan and through the South Bronx might instead proceed through, as reduced Midtown gridlock made cross-Manhattan routes more attractive to truckers. Thinner traffic streams into the congestion zone originating in Westchester and Connecticut could diminish “rat-running” on local roads by unsnarling area highways.
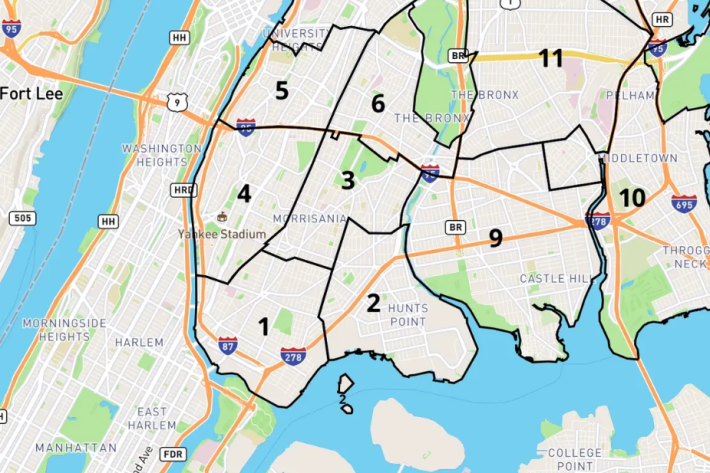
But all that was supposition. With six months of data since the successful launch of congestion pricing, the time had come to probe the claim that congestion pricing would aggravate long-standing traffic in the southernmost Bronx, which is riven by the Major Deegan (I-87) and the Bruckner (I-278) expressways plus three heavily used bridges: the Triborough, Willis Ave. and Third Ave.
No governmental agency tracks vehicle miles traveled at the neighborhood level, but public data on trips by for-hire vehicles can shed light on Mott Haven and Port Morris. If the data show lower vehicle speeds this year, that would signify increased traffic levels, while higher speeds would indicate a reduction.
I reached out for help to Todd Schneider, the data virtuoso who in 2017 gained renown for his interactive model comparing Uber and Citi Bike speeds in most of Manhattan and parts of Brooklyn and Queens. Our ticket would be the trip data that Uber reports to the Taxi & Limousine Commission that met these criteria:
- Our study period is the first halves of 2024 and 2025.
- Trip started and ended within the Mott Haven/Port Morris zone (Zone 168 in the TLC database).
- Weekdays only.
- Trip started between 8 a.m. and 6 p.m.
- Maximum of two minutes between driver arriving at the pickup location and passenger entering the car (trips with greater elapsed time would show a spuriously low imputed vehicle speed).
- Remove trips over 10 miles or whose computed speed exceeded 100 mph.
- No special requests (shared rides, wheelchair-accessible, etc.).
Todd’s query yielded a combined total of 32,000 trips across both years. He then divided each trip’s recorded distance by its trip duration, yielding trip speed. (Taxi trips were too few to analyze, and Lyft trip data was insufficient to compute trip speeds accurately.)
Our Findings

Congestion pricing commenced on Jan. 5, 2025. The interval from that Sunday through Saturday, June 28, the most recent day in TLC’s database, comprises 25 weeks.
There was no discernible change in vehicle speeds in Mott Haven and Port Morris in those 25 weeks vis-à-vis the same period a year earlier. The average 2025 speed for those weeks, 8.04 mph, was a minuscule 0.5 percent less than the 8.08 mph speed for the same 25 weeks of 2024.
Speeds were higher in 2025 than in 2024 in nine of the 25 weeks, lower in 14, and about the same in two. Lower speeds predominated in the second half of the period (see bar graph), but the slight downward turn wasn’t statistically significant (see discussion below). The bottom line is that traffic speeds in Mott Haven–Port Morris have neither deteriorated nor improved with congestion pricing.
This indicates that traffic volumes today in Mott Haven and Port Morris do not differ from those before congestion pricing. Any diversions of traffic into those communities being triggered by the tolls are evidently being offset by other travel changes — most likely, by reductions in vehicular traffic through Mott Haven and Port Morris en route to the Manhattan congestion zone.
Let’s dig into Todd’s and my methodology and findings.
Detailed findings
The line graph below compares average speeds in the study area for the 25 before and after weeks.

I noted earlier that observed speeds in Mott Haven and Port Morris were lower in 2025 than in 2024 in a majority of the 25 weeks. This can be seen in the scatterplot below of year-on-year variations in travel speeds. The trend line in the graph expresses the “linear best-fit relationship” between each week’s percent speed change and its place in the 25-week sequence. The relationship is tenuous, with an average rate of decrease in speeds of just one-tenth of one percentage point (0.102 percent). Tellingly, this faint trend is statistically significant to only the 60-percent confidence level — far less than the standard 95-percent confidence level at which a correlation relationship between two phenomena (here, speed decreases and time since Jan. 5) may be deemed a true occurrence rather than an inauthentic one.
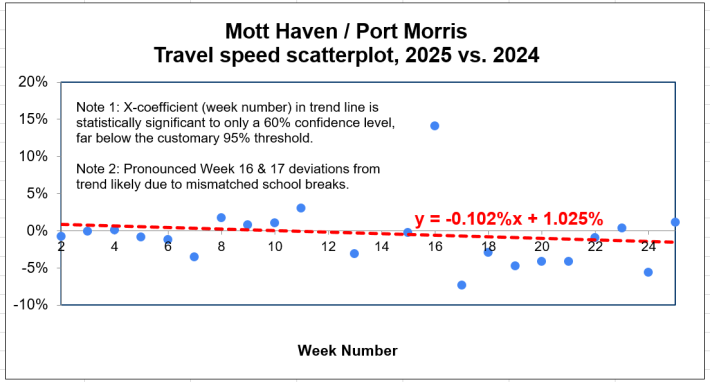
The failure of the trend line to satisfy the bedrock criterion for statistical significance indicates that travel speeds in Mott Haven and Port Morris haven’t been negatively affected by congestion pricing. In the absence of direct measurements of vehicle volumes in Mott Haven and Port Morris, I take the observed constancy of traffic speeds as proof that congestion pricing in New York City is not resulting in increased traffic volumes in the environmentally sensitive and overburdened southernmost South Bronx.
Conclusions
As reported in the Regional Plan Association‘s comprehensive June analysis, traffic volumes are generally lower within and en route to the congestion zone, and vehicular speeds are correspondingly higher. The congestion revenues are enabling the MTA to embark on system-wide improvements including subway station elevators and modernized track signals.
It’s undeniable, then, that congestion pricing is delivering substantial benefits to New York City and the surrounding region, even counting the toll costs to motorists along with the foregone value of trips priced off the roads. The program’s palpable success and correspondingly rising public acceptance are prompting other U.S. cities to consider traffic tolling while reviving interest in pricing other pollution “externalities.”
Yet this robust web of benefits reached fruition with the thinnest of margins. At a long series of decision points, implementation of congestion pricing could have ― and did, in 1973, 2008 and 2024 ― come clattering to a halt. The obstacles were legion, and doomsaying about possible collateral damage to the southernmost Bronx struck a chord. The prospect of benefiting more-privileged Manhattan interests at the expense of comparatively encumbered and voiceless communities on the fringes suggested a rank injustice, handing ammunition to critics intent on scuttling congestion pricing.
Nevertheless, faster commutes and greener streets were never congestion pricing’s be-all. An equal-magnitude benefit, one that promised to be distributed far more equitably than Manhattan congestion relief, lay in the billions of dollars of transit investments to be bonded by the congestion toll revenues.
In Mott Haven alone, the MTA has pledged congestion revenues to make two subway stations accessible (Brook Ave. and Third Ave./East 149 St.) and to renovate one station altogether (Third Ave./138th St.). Four nearby bus depots are slated for electrification, and 250 new quiet and emission-free electric buses will be ordered. Moreover, new digital signals on Manhattan portions of the Sixth Ave. subway line will, before long, make B and D train service to and from the South Bronx more frequent and reliable.
These benefits went unmentioned, or even hinted at, in the hypercritical Inside Climate News and New York Times stories, save for the anodyne mention by the Times that “The [congestion pricing] program aims to provide funds for mass transit and get cars off the road.” In those stories and others, congestion pricing’s transit bounty for Bronx residents and indeed every New Yorker might as well not have existed.
Links to our data
Data scientist Todd Schneider uses the proprietary developer platform GitHub to store and share the code he develops for transportation-related work:
- This link goes to Todd’s public repository, and offers code to help users download data from the Taxi & Limousine Commission website and load it into a query-able database.
- This link stores the query he used to generate the data in the spreadsheet in which we analyzed and graphed the data discussed in the report.
- And my Excel spreadsheet containing the travel speed data and graphs reported here may be downloaded here.

Read More:
Streetsblog has migrated to a new comment system. New commenters can register directly in the comments section of any article. Returning commenters: your previous comments and display name have been preserved, but you'll need to reclaim your account by clicking "Forgot your password?" on the sign-in form, entering your email, and following the verification link to set a new password — this is required because passwords could not be carried over during the migration. For questions, contact tips@streetsblog.org.