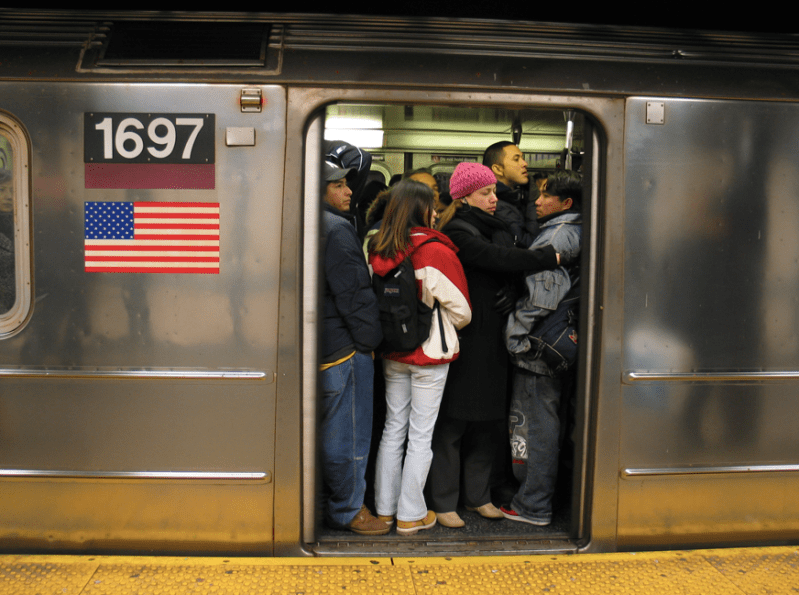
Although subway ridership has been hovering at around 30 percent of its normal bustling population since last year, it's been obvious for some time that the drop hasn't been equally distributed, as maps from datasmiths and deep dives from institutional media have shown. Now the state's top money man is getting in on the game, with a new dashboard that combines neighborhood ridership data with median incomes to show who's been riding the subway since the pandemic started.
Comptroller Tom DiNapoli unveiled a online tool on Friday morning that will track monthly subway ridership patterns by neighborhood, compared to ridership numbers from February, 2019. In addition to the subway population, the website shows neighborhood median income, the percentage of immigrant households and the top jobs for every neighborhood, all in an effort that shows that while subway ridership has gone off the rails, the city's low-income workforce has still been on them.
"As this dashboard makes clear, the New Yorkers returning to the subways are those who most need it, including many from The Bronx, Brooklyn and Queens who work in lower wage, public-facing jobs,” said DiNapoli. “The straphangers putting money into the fare box right now are the ones who can least afford to lose service or pay more for it."
The dashboard shows that that nine out of 10 neighborhoods that had the highest subway ridership in February, 2021 are in Queens or the Bronx, with the highest subway ridership at 45.6 percent of pre-COVID numbers in Flushing, Murray Hill and Whitestone in Queens. Half of the 10 busiest stations by ridership are in Brooklyn, although the 191st Street 1 stop in Manhattan is a huge outlier with a ridership spike of 192.8 percent in February, 2021, compared to the benchmark reading.
"As New York begins its recovery, it’s vital that New York state maintain affordable and reliable subway service for our immigrant community members, many of whom have no other means of transportation," said Murad Awawdeh, the co-interim executive director of the New York Immigration Coalition. "We applaud Comptroller DiNapoli’s efforts with the online tracker to ensure that the state’s decisions around subway service are guided by objective data and the needs of community members."
The interactive map is coming out as the MTA escapes of a financial crisis that is no longer a crisis thanks to the federal money cannon firing a $6.5 billion check at the transit agency. But so far, that hasn't stopped a "rightsizing" (read: service cut) on the C and F lines, or a threatened fare hike that has so far only been "postponed." But advocates are hopeful that with data like this available to the public, and future MTA decisions on service patterns or pricing will be informed by the ridership patterns as they exist now, not the way they existed before the pandemic.
"Comptroller DiNapoli's MTA Dashboard lays bare how ridership changed as commuting patterns shifted over the past year," said Riders Alliance Director of Communications and Policy Danny Pearlstein. "It affords important insight into how communities rely on public transit that can help inform public investments in service and infrastructure as we build back."
The MTA, for its part, said that the data was proof of why continued federal investment in mass transit is so necessary.
"This data shows what we have known all along: lower income New Yorkers and people of color have been disproportionately impacted by the pandemic, are most reliant on public transit and make up our essential workforce that has kept New York running during the COVID crisis," said spokesperson Shams Tarek. "This is exactly why federal investment in the MTA remains so crucial — ensuring public transit continues to be the great equalizer, opportunity-provider and economy-driver that it has always been."


