Report: Pedestrians Are At Risk … Where You’d Least Expect It
The city Department of Transportation may be underestimating the number of pedestrians on outer-borough streets, due to a Manhattan-first bias that may end up putting pedestrians at risk, a new study finds.
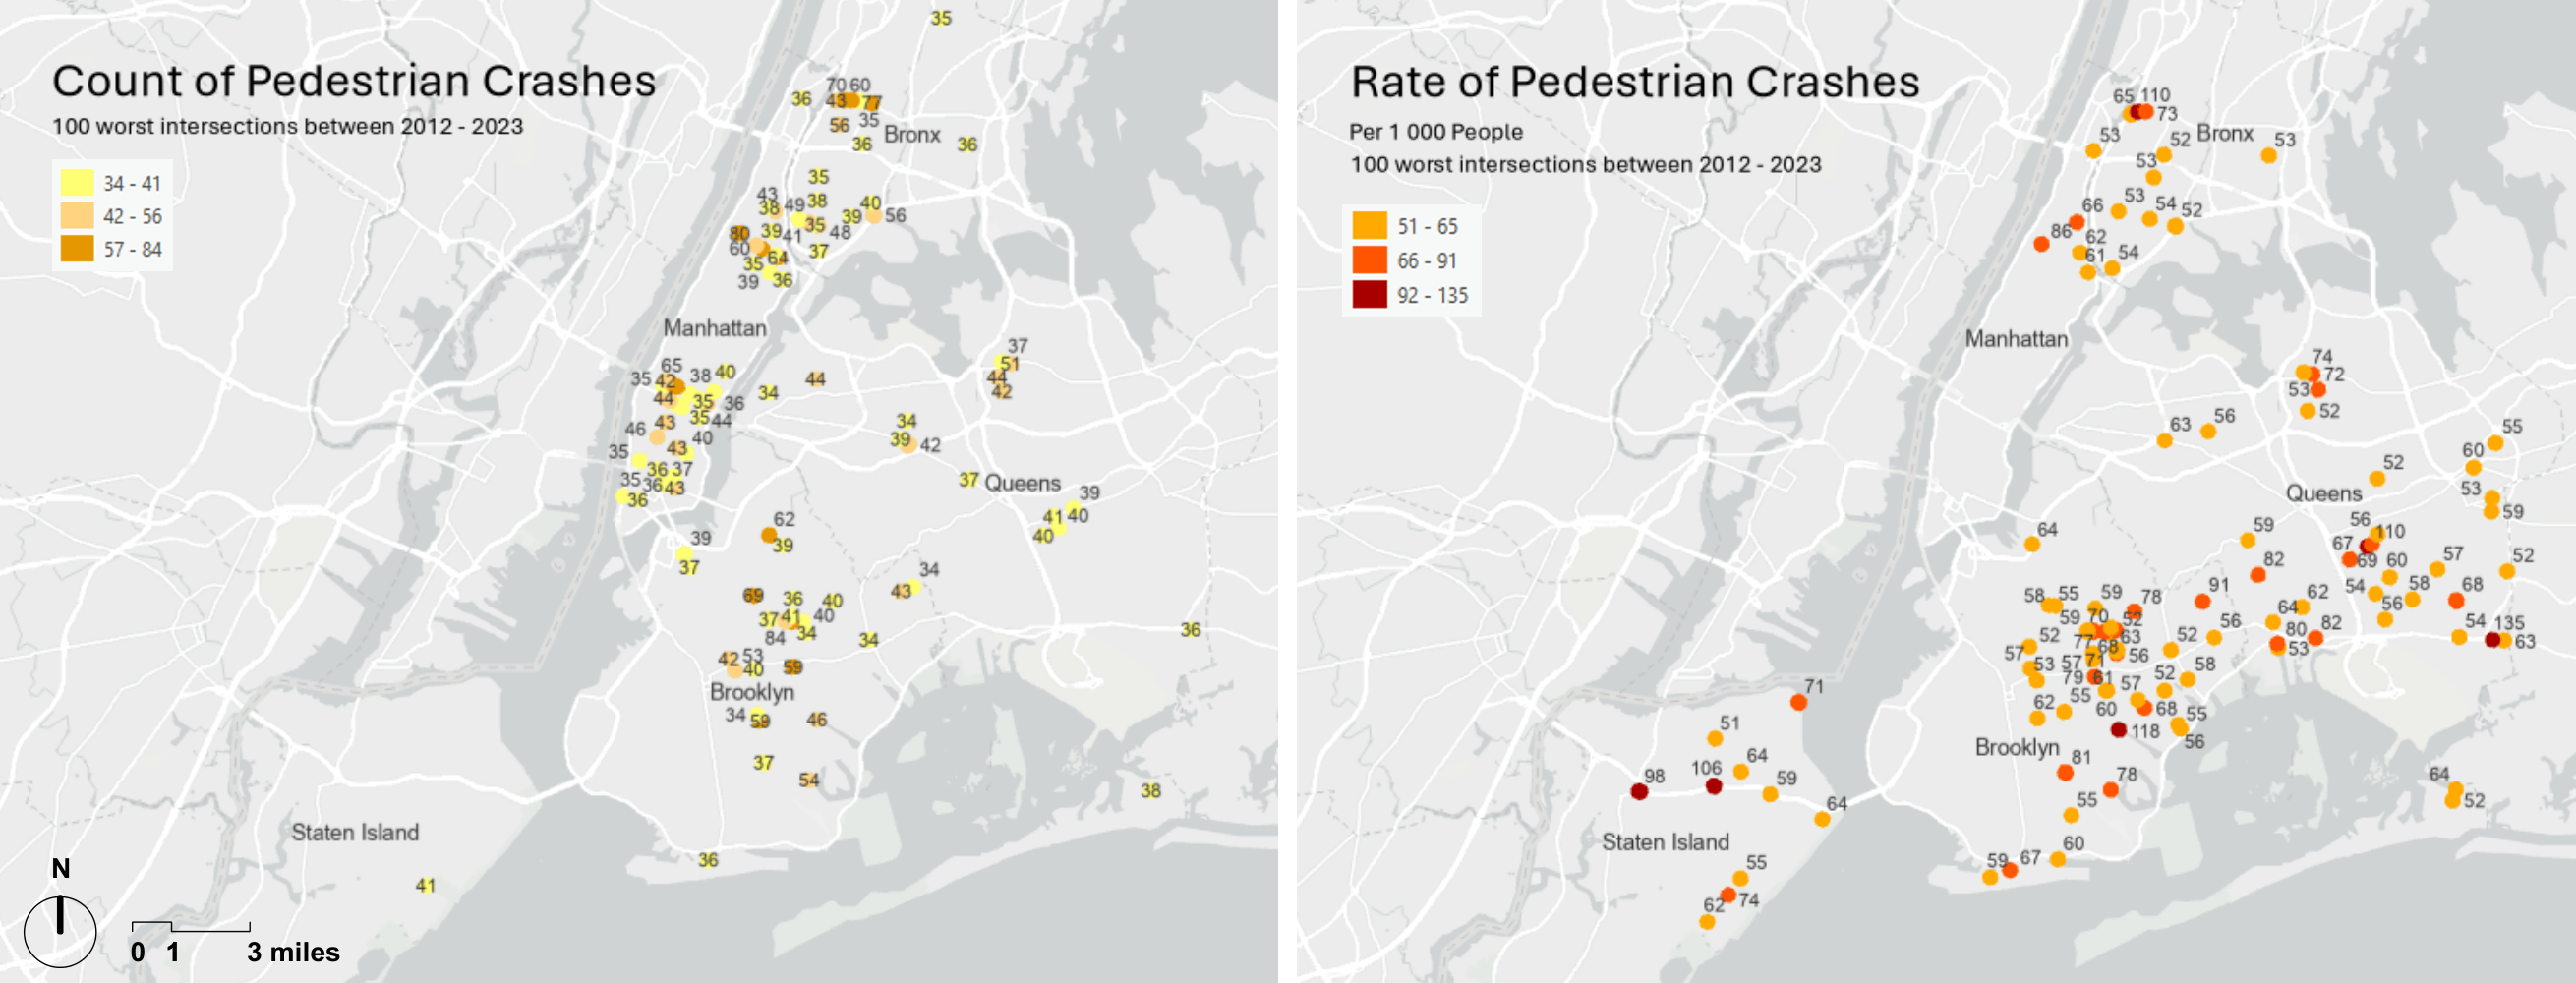
An MIT research group created the first complete model of pedestrian activity in any U.S. city — and it revealed that intersections with the highest pedestrian injury risk are frequently outside Manhattan, despite that borough’s higher raw number of pedestrians.
By examining injury risk per pedestrian, instead of total crash counts, researchers identified higher injury risk in low-income neighborhoods of eastern Brooklyn and southeastern Queens — and this could be because heavy car infrastructure such as wide streets or industrial zoning lingers in low-income neighborhoods.
“In this estimation, there is no specific indicator of like, ‘OK, this is a low-income neighborhood, or this is a neighborhood that depends on walking or public transit,’ [the finding] is suggestive that actually, on a per pedestrian basis, there are a bunch of relatively dangerous locations in these other boroughs outside of the highly foot-trafficked areas of Manhattan or Brooklyn,” said Andres Sevtsuk, the associate professor of urban science and planning at MIT who led the study.
Researchers also found that DOT’s categorization of streets, from roads with low pedestrian volume to the city’s busiest, doesn’t reflect the model’s estimated pedestrian volumes. Based on the MIT study’s pedestrian activity, around 5,256 miles of streets are “undercategorized,” meaning they’re busier than what the DOT found.
Most undercategorized segments are in Brooklyn and Queens. These categorizations have real-world impacts, guiding pedestrian policy and likely impacting infrastructure investments and layout regulation, producing “palpable benefits for streets and neighborhoods that have more segments with higher classifications,” the report said.
Sevtsuk said that DOT categorized the streets “without really knowing how many people walk where,” and that DOT didn’t know the actual citywide pedestrian volumes and did “the best they could” without that information. The researchers regularly communicated with DOT about the study and the department is aware of the research.
“There’s actually plenty of very-high-foot-traffic corridors outside of Manhattan that are undercategorized today,” Sevtsuk told Streetsblog. “There’s a certain bias towards giving higher categories to streets that are inside Manhattan.”
DOT determined street categories considering pedestrian generators, including parks, tourist attractions, transit and more, as part of its Pedestrian Mobility Plan released in 2020.
A DOT spokesperson told Streetsblog that the department is “actively exploring ways to collect better data” and has been working with MIT on the study and future projects to “build a more comprehensive model for predicting pedestrian activity.”
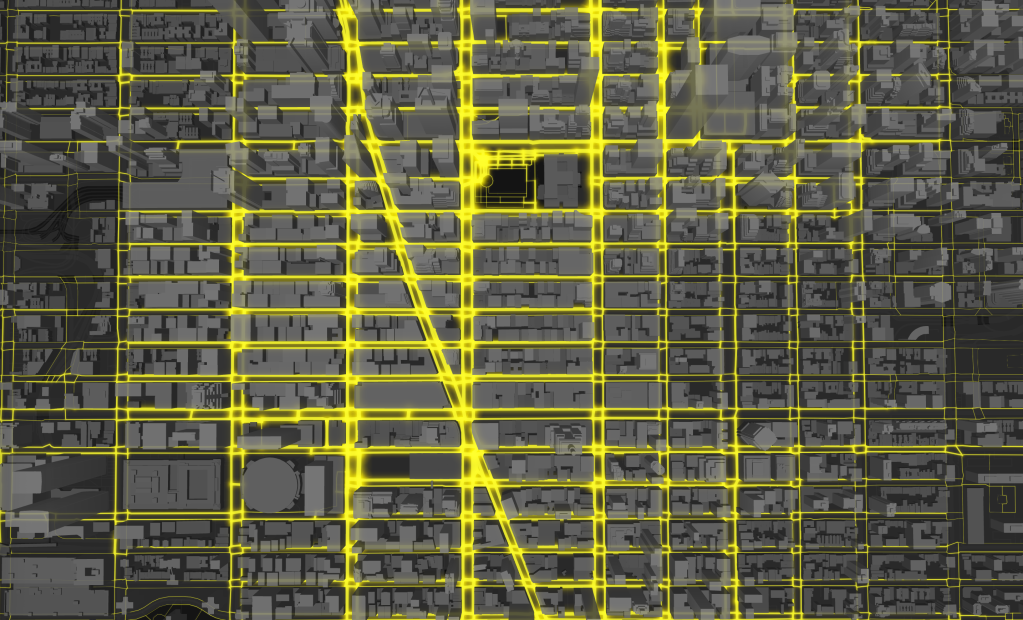
To create the model, researchers assembled a dataset of crosswalks, footpaths and sidewalks across the whole city, ignoring jaywalking and unmarked crossings. They calibrated the model using DOT’s pedestrian counts from 2018 and 2019, covering as many as 1,000 sidewalk segments on weekdays and up to around 450 segments on weekends. They then tested the model against the city’s pedestrian count data.
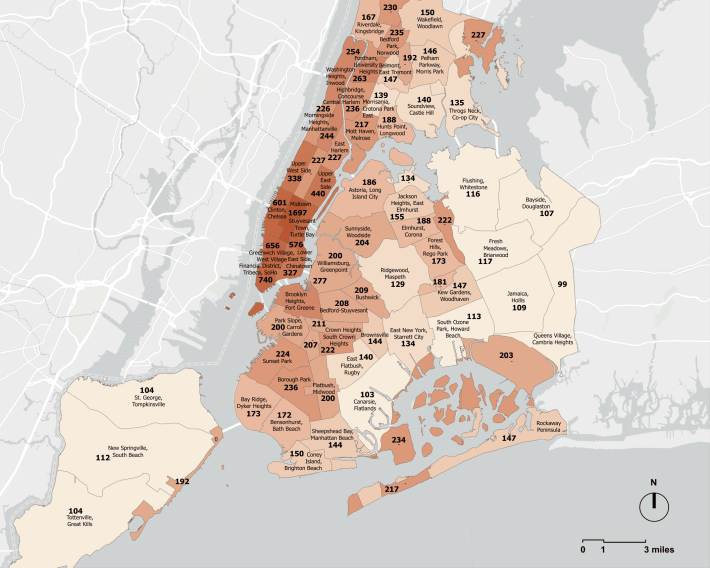
With the model calibrated, it could expand foot-traffic estimates beyond where pedestrian counts were observed and throughout the entire city. Looking at the city’s 59 community districts during the busiest peak period, weekday evenings, average pedestrian volume in Midtown Manhattan is the highest, the Financial District is in a distant second and Greenwich Village is in a close third.
Some areas in the outer boroughs, like University Heights in the Bronx or Sunset Park in Brooklyn, are busier than parts of Manhattan, such as East Harlem.
The findings come with one major caveat: the modeling did not take into account tourist attractions, historic sites, land-use and institutional considerations, which the MIT authors admitted affect pedestrian volumes.
With the new data that the model provides, Sevtsuk said that he’d like to see the information about foot traffic levels throughout the city become institutionalized and used in policymaking.
Walking is the least understood and measured mode of urban travel, even though it’s most prevalent. Sevtsuk thinks this is because walking is not monetized.
“Nobody’s earning revenue from people walking, so there’s less business interest around that,” he said. “There’s an enormous industry behind driving, and therefore, there’s lots and lots of research money and analysis at all levels behind driving.”
Historically, the Federal Highway Administration has relied on vehicle miles traveled to determine the amount of transportation infrastructure funding that states receive, what Sevtsuk called “basically counting cars.” Until there is a comparable method for non-motorized modes, like bikes and pedestrians, he said, there can’t be serious informed decision-making that can support walking and cycling.
Sevtsuk hopes that the MIT study contributes to DOT’s work and that further work is done to better understand pedestrian and cyclist behaviors.
“I would love to see that we move towards this sort of future where the non-motorized modes are modeled and counted with the same kind of rigor that cars have been counted for decades already and that becomes the basis for informed decision making,” Sevtsuk said.

Read More:
Streetsblog has migrated to a new comment system. New commenters can register directly in the comments section of any article. Returning commenters: your previous comments and display name have been preserved, but you'll need to reclaim your account by clicking "Forgot your password?" on the sign-in form, entering your email, and following the verification link to set a new password — this is required because passwords could not be carried over during the migration. For questions, contact tips@streetsblog.org.