Memo to Mamdani: Data Shows Massive Jump in Ridership on Bedford Avenue’s Embattled Bike Lane
Ridership data for a year-old protected bike lane on Bedford Avenue in Brooklyn — which was scaled back by the former mayor — appears to confirm the longstanding hypothesis that safer bike lanes mean more bikers. The statistics should persuade Mayor Mamdani to ignore local resistance and repair his predecessor’s damage by fully protecting the path and expanding the city’s bike lane network at a much faster pace.
Under former Mayor Eric Adams, the Department of Transportation upgraded Bedford’s existing-but-unprotected bike lane, between Crown Heights and South Williamsburg, into a parking-protected one in December 2024. But local leaders later convinced Adams to replace its three northernmost blocks with unprotected paint.
Despite this setback, the (mostly) protected path attracted nearly 60 percent more cyclists in the year since its debut. Some months posted even more dramatic year-over-year increases in cycling traffic.
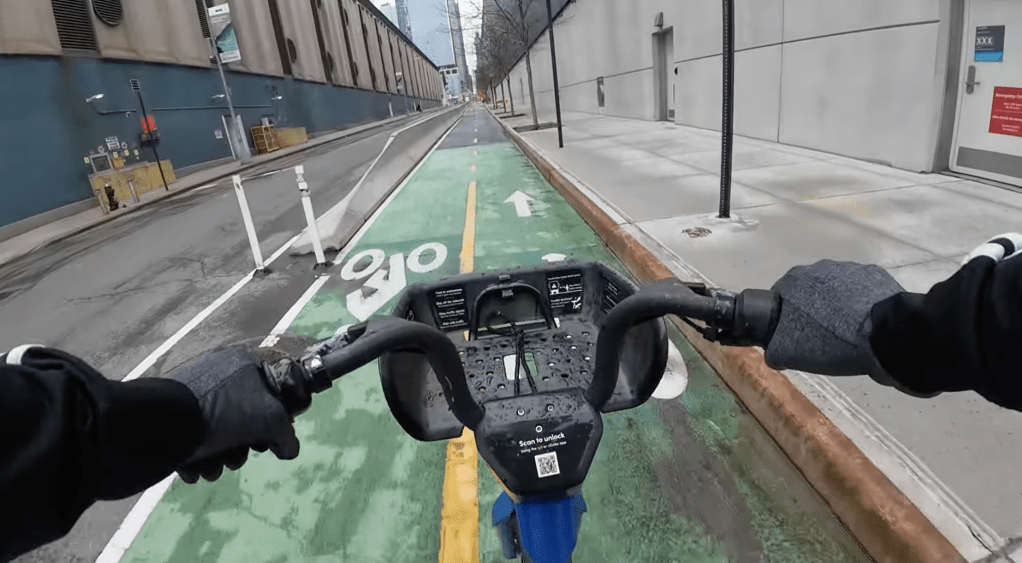
The green lane on Bedford Avenue became an enduring symbol of New York City’s trilateral culture war between car drivers, pedestrians, and cyclists. But it also offered an opportunity to measure the real-world effects of installing a protected cycling path on bike usage and traffic. To do so, I built a web app that aggregates Citi Bike trip data across the five boroughs — with a twist.
Raw Citi Bike trip data do not tell the entire story of cycling in New York. They don’t capture cyclists who ride their own bikes, or show exactly where Citi Bikers go before and after their trips between docks. Still, the data are a reliable and granular record of where cyclists are moving.
Most Citi Bike tracking applications revolve around trip data generated by individual docks. This is a problem for gathering useful data because Citi Bike docks are constantly in flux: New ones open, old ones close, and they move around from time to time. Riders sometimes need to visit two or three docks, both when finding a suitable bike to ride and when finding an open spot to return it. All of this means that, in practice, Citi Bikers typically rely on multiple docks near each other.
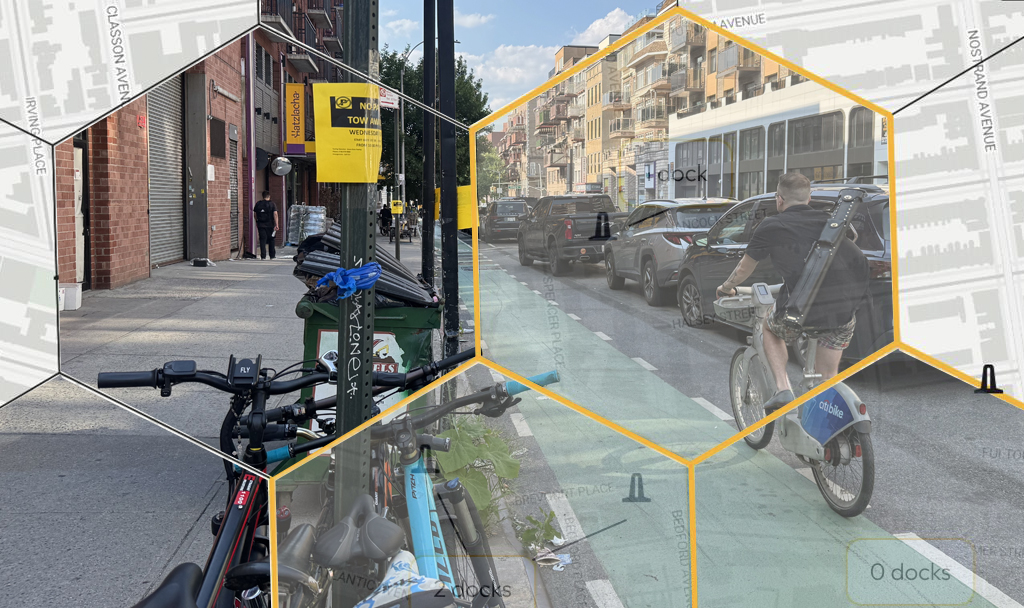
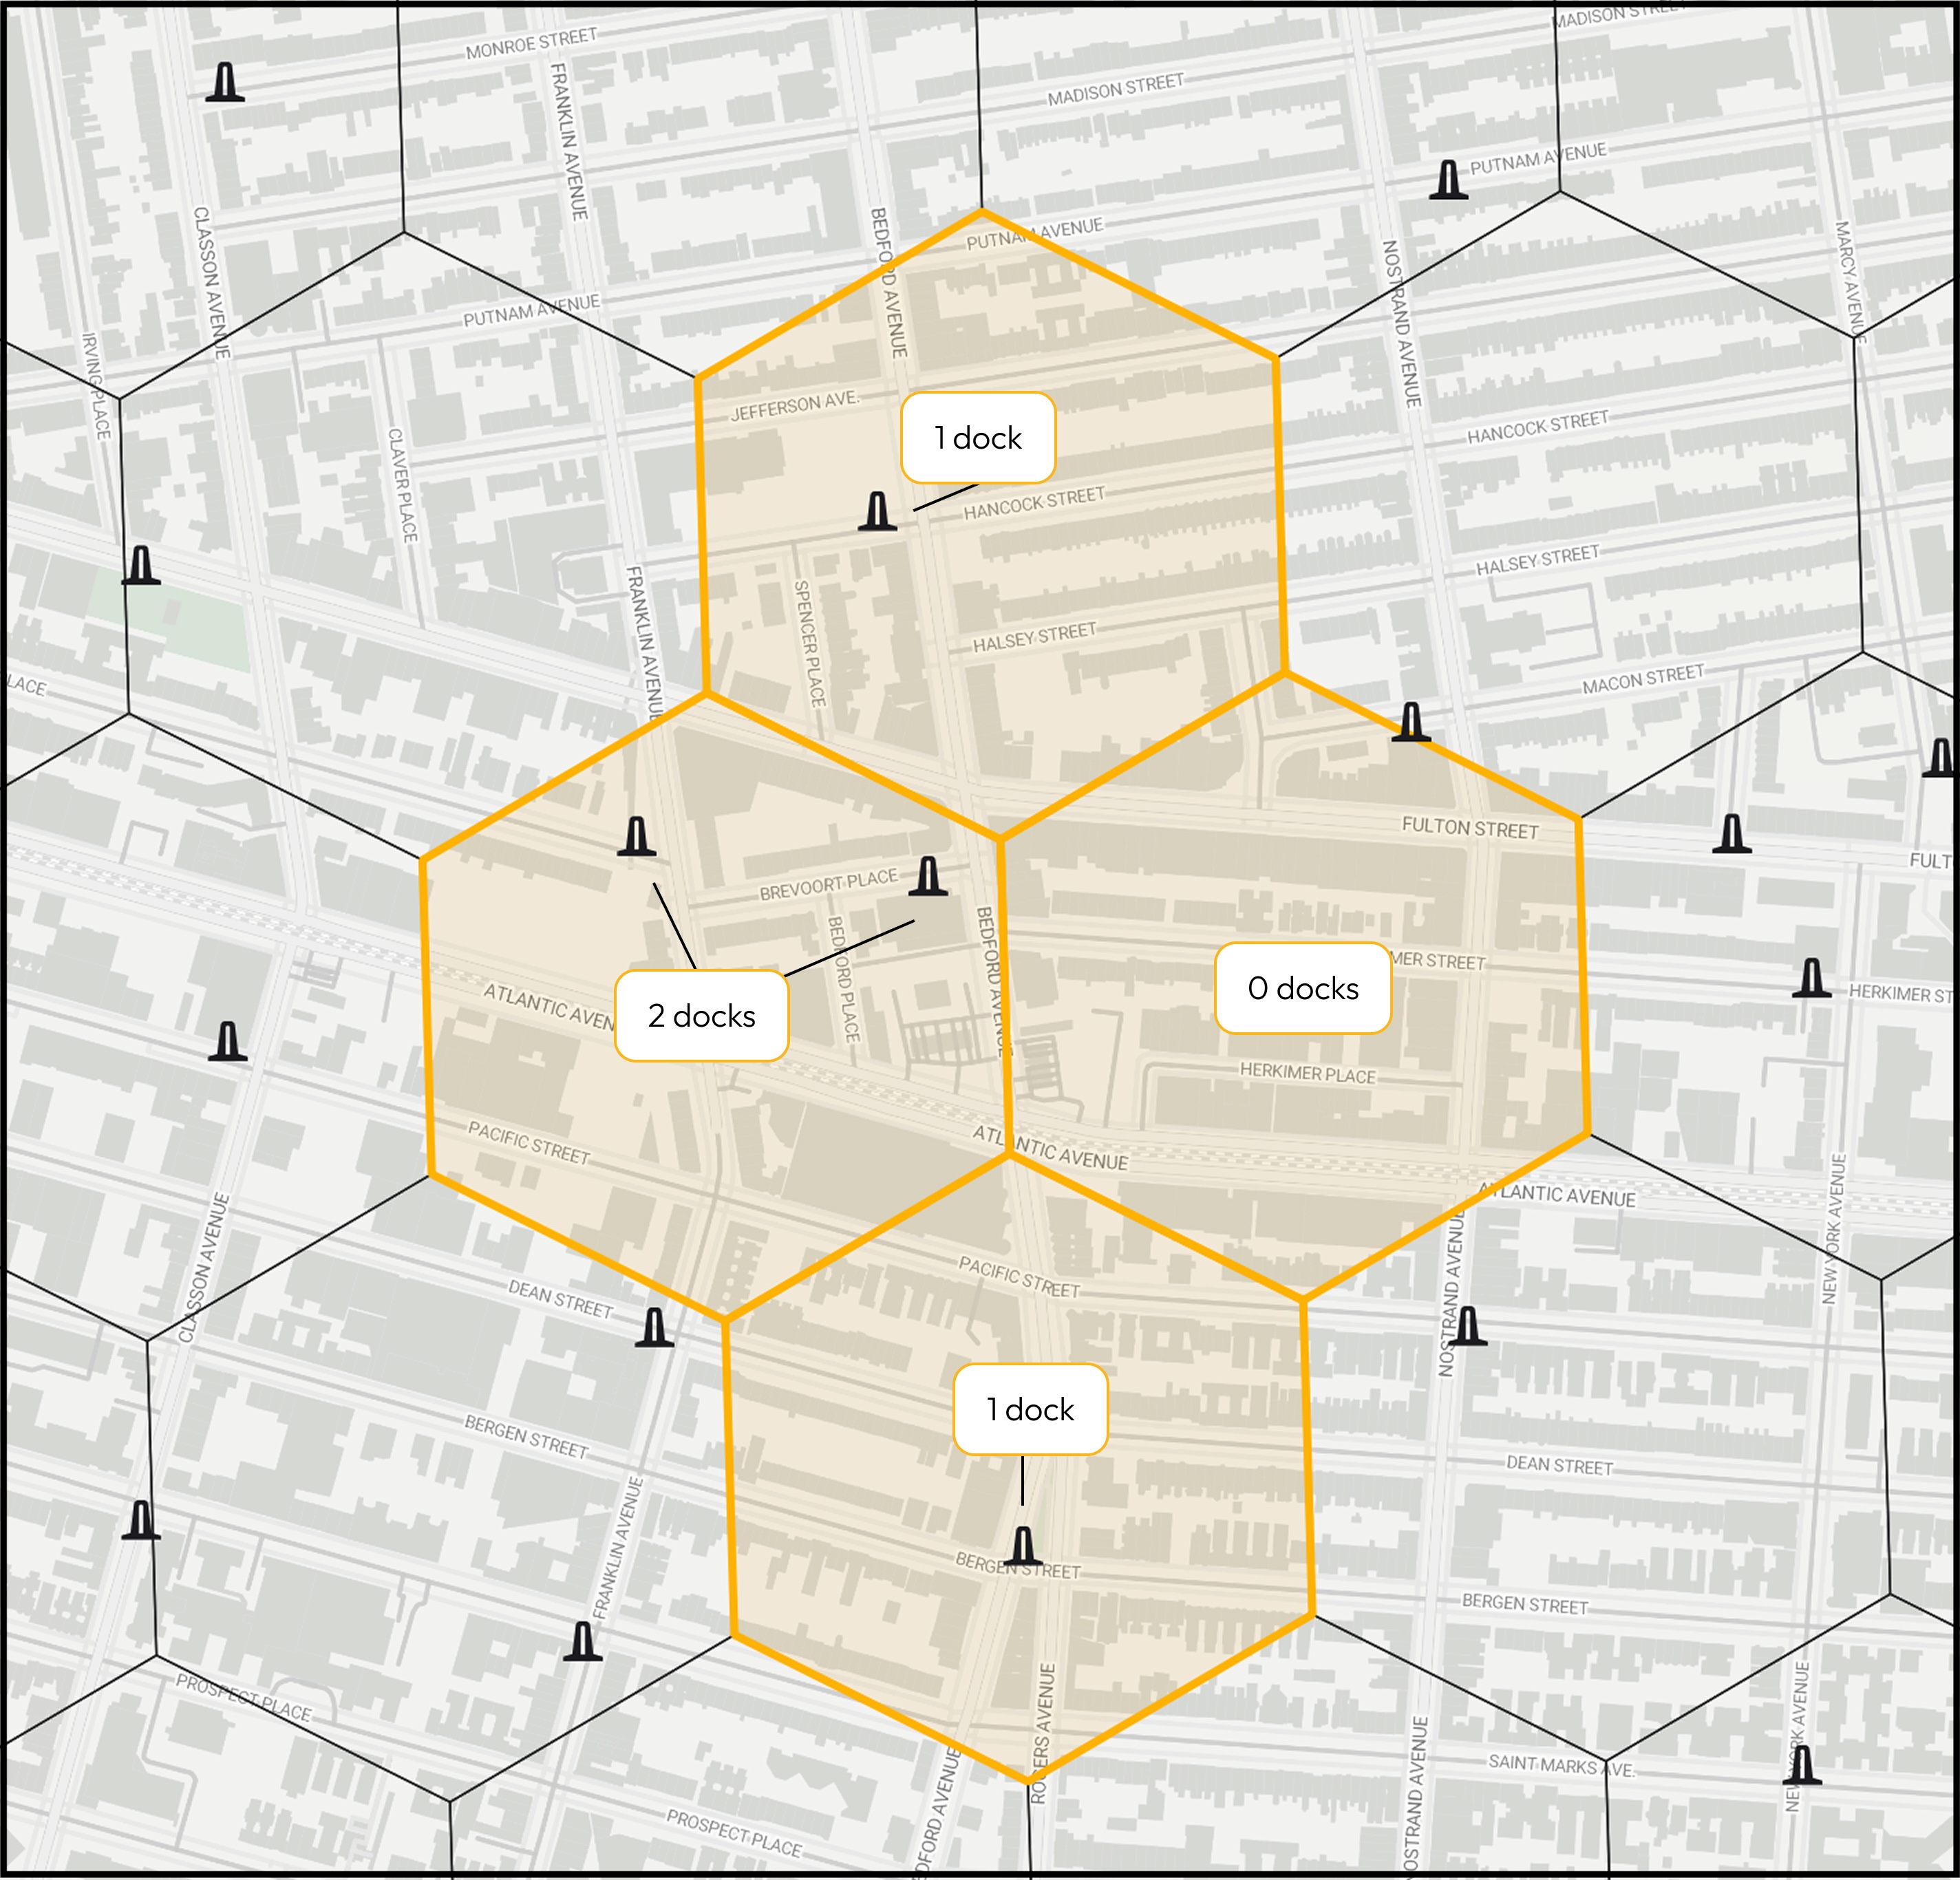
To account for this reality, my web app divides New York City into standard hexagonal tiles, each of which contain an arbitrary number of docks. I used hexagons because they are crucial to mapping the movement of people between arbitrary points on a flat plane — in this case, New York’s streetscape. This allows the app to track movements not only between two stations, but between two regions.
The image below shows the dock locations from an area near the Bedford bike lane in September 2025. There are between 0 and 2 docks per cell in this region. The app counts trips by cells rather than individual docks.
So what does the app say about cycling patterns on the Bedford Avenue bike lane? Here is a screenshot of the app with an origin near the start of the bike lane, and a destination at the end of the bike lane. You can see this selection at this link.
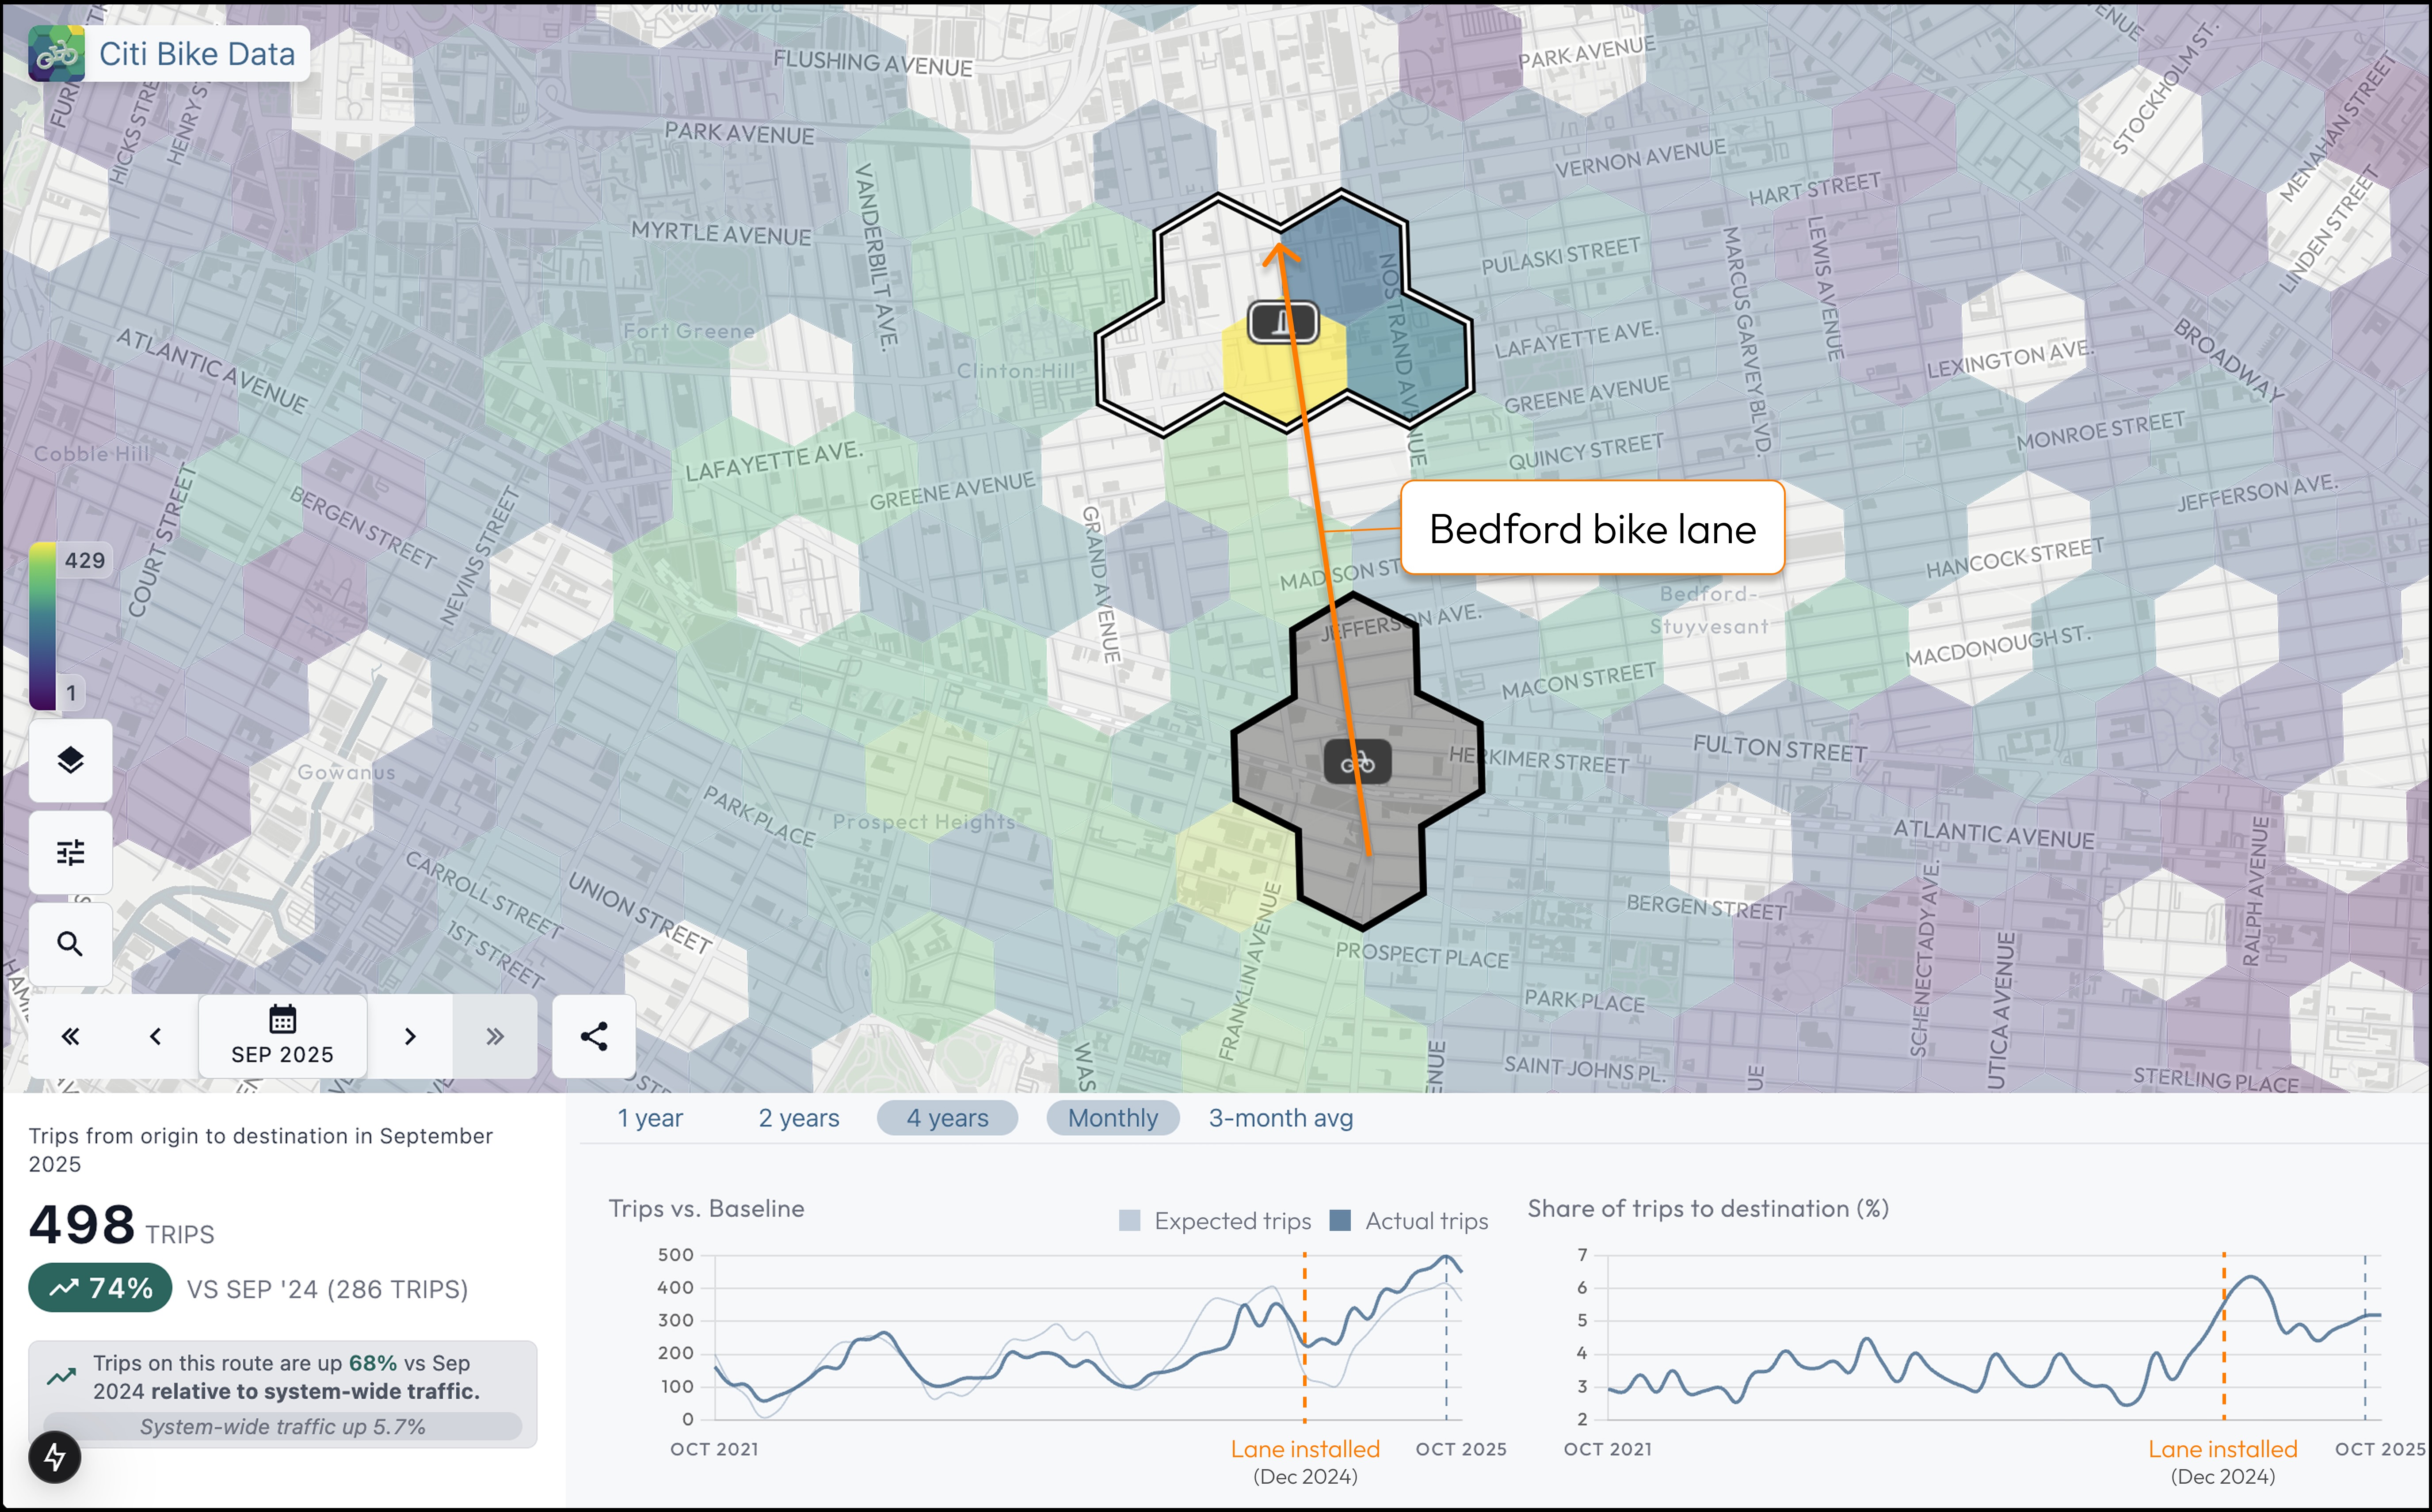
We see 498 trips in September 2025 — a 74-percent increase from 286 trips in September 2024. That’s pretty substantial. But how do we know that overall traffic didn’t increase by 74 percent? That is the purpose of the gray box at the bottom. It shows how much traffic increased on this route compared to all traffic leaving the origin. Traffic across the system increased by 5.7 percent. So compared to overall fluctuations in traffic, this route increased by 65 percent.
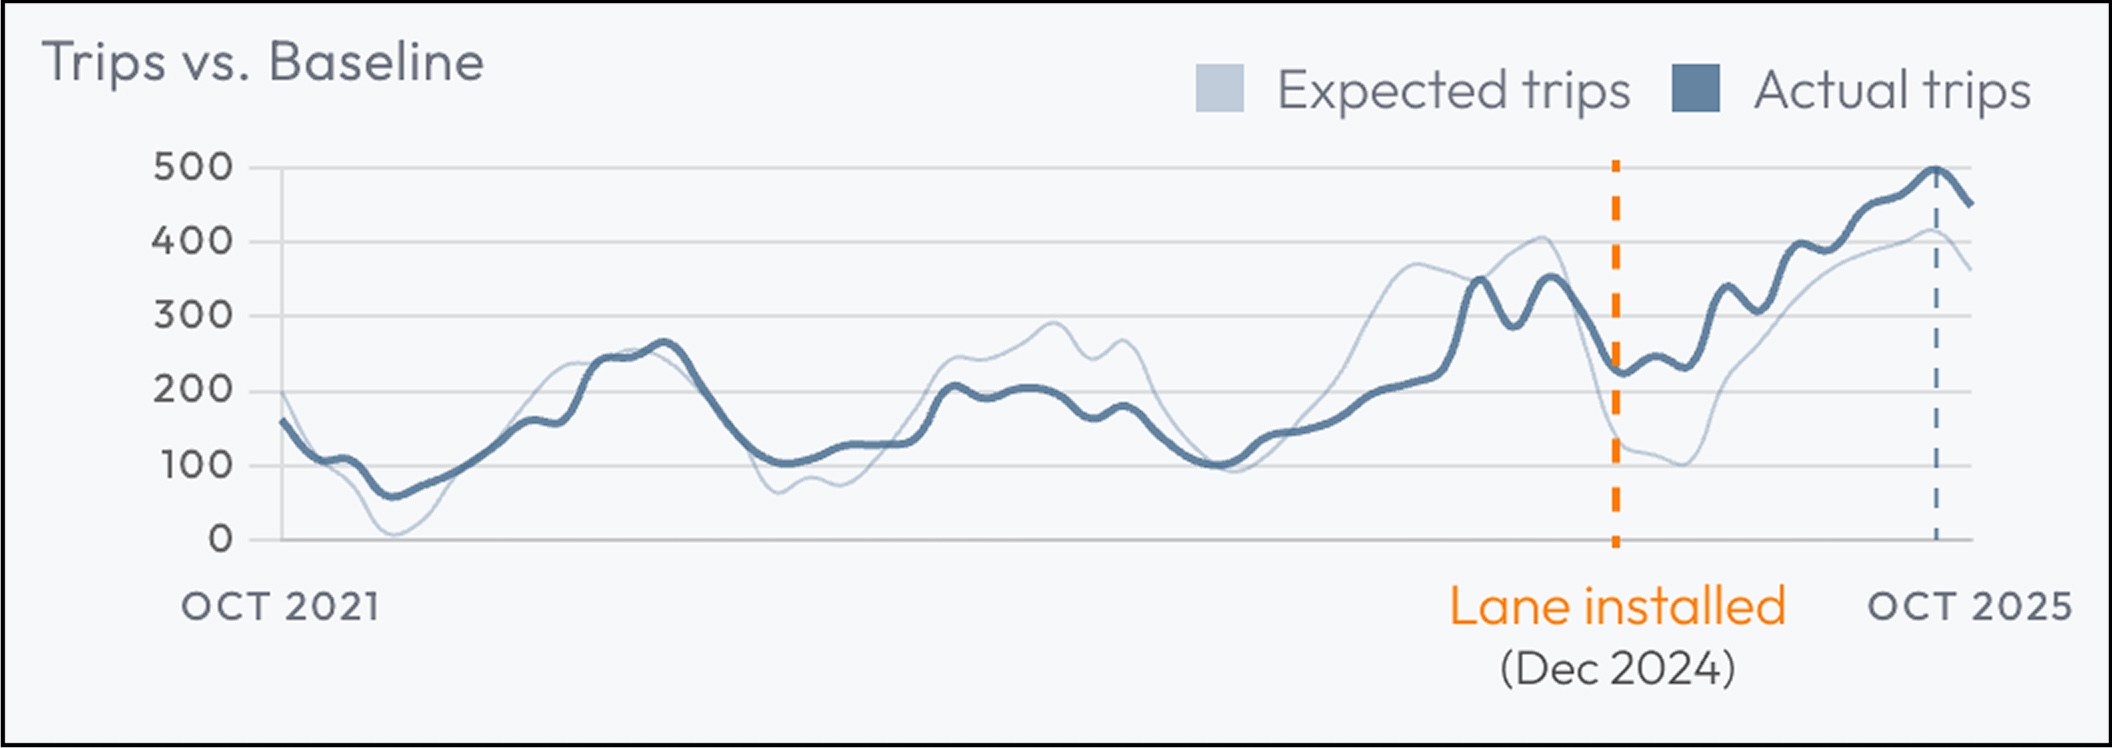
Let’s take a look at the two charts. The first chart compares actual trips between the selected origin and destination to what we’d expect based on citywide cycling patterns. I calculated the values for these “expected trips” by scaling, or normalizing, overall system traffic to match the average of the selected route. This preserves seasonal fluctuations, such as summer peaks and winter dip, while making it easy to spot how this route deviates from the norm. As you can see, actual trips closely tracked the “baseline” pattern until the completion of the lane in December 2024. After that, cycling on this route grew well above what citywide trends would predict:
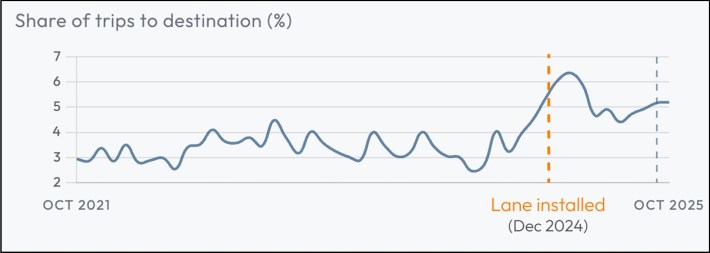
The second chart shows the trips going to the destination as a percentage of total trips leaving the origin. We can see that before the installation of the bike lane, approximately 3 percent of trips were from the origin to the destination. After the installation of the bike lane, this jumps to around 5 percent:
I focused on September, but the upward trend is consistent throughout 2025. Starting from December 2024 these are the normalized traffic increases along this route:
Summing the changes over this 13 month period from December 2024 through December 2025 compared to the same period in the previous year, the normalized change is 57.4 percent, or 62.4 percent in absolute terms.
In the span of a year, the Bedford Avenue bike lane produced a nearly 60-percent increase in cycling traffic along its route, far exceeding typical year-over-year growth. While Citi Bike trips represent only a portion of total cycling activity, this segment alone demonstrates the bike lane’s transformative impact on travel patterns in the area.

Read More:
Streetsblog has migrated to a new comment system. New commenters can register directly in the comments section of any article. Returning commenters: your previous comments and display name have been preserved, but you'll need to reclaim your account by clicking "Forgot your password?" on the sign-in form, entering your email, and following the verification link to set a new password — this is required because passwords could not be carried over during the migration. For questions, contact tips@streetsblog.org.