Data: Congestion Pricing is Not Rerouting Traffic to Other Boroughs
Tired: Drivers are going to avoid congestion pricing by flocking to highways and bridges that circumvent the zone and inundating the Bronx and Staten Island with cars.
Wired: That’s not actually happening.
Traffic volumes on the Verrazzano, Triborough, Whitestone and Throgs Neck bridges dropped in February after a brief rise shortly after congestion pricing launched in January, new data shows — defying the MTA’s pre-toll forecasts for increased outerborough highway traffic.
At the same time, vehicle entries into Lower Manhattan dropped by double digits in January and February after congestion pricing began on Jan. 5.
Looking at traffic patterns on the bridges for the last three years, the story of the crossings looks like one that reflects the region-wide increase in driving since New Yorkers started leaving the house more often after the height of pandemic shutdowns:
- On the Whitestone Bridge, there were 120,192 average daily crossings in January 2024 and 121,975 in January 2025 — a slight increase. But the 126,566 average daily crossings in February 2024 dropped 2 percent to 123,939 in February 2025.
- On the Throgs Neck Bridge, there were 106,458 average daily crossings in January 2024 and 110,856 in January 2025 — again, a slight increase just as the tolls began. But there were 112,351 average daily crossings in February 2024 and 112,038 in February 2025 — a decrease, albeit tiny.
- On the Verrazzano Bridge, there were 199,204 average daily crossings in January 2024 and 204,314 in 2025 — an increase. But there were 209,226 in February 2024 and 206,601 in February 2025 — a decrease of 1.2 percent.
- On the Triborough Bridge, there were 168,740 average daily crossings in January 2024 and 173,924 in 2025, an increase. But there were 177,963 in February 2024 and 176,381 in February 2025, a very small decrease.
That drop in February bridge traffic occurred even as car trips into the zone also dropped — indicating that congestion pricing may not have rerouted traffic around Manhattan as predicted, but in fact eliminated many car trips entirely.
In January, an average of 553,000 vehicles per day drove into Manhattan below 60th Street, including on the un-tolled West Side Highway or FDR Drive and within the toll zone proper. That number reflected a 5.4-percent reduction compared to the historical average. In February, that reduction rose to 9 percent below the historical average.
It’s still early, but experts said the reduced trips into the central business district don’t appear to be turning into through-trips in the south Bronx or Staten Island as the MTA’s congestion pricing environmental assessment predicted might happen a little — and toll opponents predicted would happen a lot.
“What you’re seeing is fluctuations that could be due to any number of different things,” said Rachel Weinberger of the Regional Plan Association. “I’d want to monitor it, but it appears that the ripple impact of congestion pricing is not reaching those facilities.
“Without seeing more or a longer timeline, it’s hard to to say more than that, but the fluctuations we’re seeing seem very much in line with just normal fluctuations in traffic that you might expect,” she added.
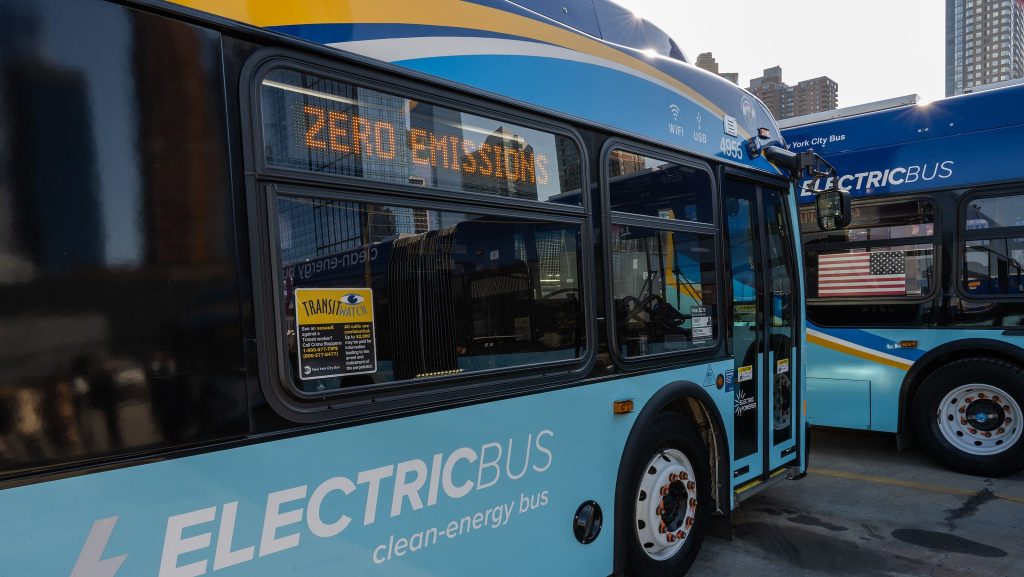
Where are those trips going? One possibility is more of these drivers are ditching the car for the train more than the MTA forecasted.
In January, public transit’s recovery towards pre-pandemic ridership numbers outpaced the 2024 rate of ridership growth on the subways and commuter rail. On the subway that trend continued into February, when total subway ridership year-over-year was higher than last year even though February 2024 had an extra day thanks to leap year.
“It’s always been my suspicion that more of the reduction in vehicles entering the zone would be due to people switching to transit, rather than vehicles that were at that time going through the zone now diverting instead around the zone,” said Weinberger.
There’s been concern over air quality impacts to the south Bronx especially ever since the environmental assessment for congestion pricing came out in 2022. The industry standard Best Practices Model used by the MTA to produce its forecast predicted that drivers who previously traveled through lower Manhattan on trips to and from New Jersey and Long Island would avoid the toll by driving up across the Bronx or through Staten Island to get a cheaper trip.
Environmental justice advocates who pressed the MTA to commit to programs that would mitigate the air quality impacts of potential traffic increases in the Bronx and other areas have reason to be reassured by the early data.
“Our members were understandably concerned about the potential uptick of traffic in the south Bronx and the whole borough being impacted by tolling infrastructure,” said Kevin Garcia, a senior transportation planner with the NYC Environmental Justice Alliance. “These preliminary numbers and the decrease in traffic are positive, and we’re hopeful it continues to go in a positive trend. We continue to look forward to holding the MTA for its mitigation plan.”
Longtime congestion pricing advocates did say shortly after the EA was published that there may have been some holes in the model the MTA relied on when putting together its estimates.
One assumption the modeling may not have taken into account is that making it more expensive to drive doesn’t necessarily mean mean existing trips will scatter out from a place like Manhattan. Instead, those trips may disappear entirely, while drivers willing to pay a toll pay to take advantage of faster trips.
“The Best Practices Model seems to be refraining from projecting net decreases in vehicular travel in the region” said transportation economist Charles Komanoff. “The only rebuttal to that idea would be the whole diversion thing. But diversion is just hugely overrated, because diversion fails to take into account the time savings of continuing to use the zone.”

Read More:
Streetsblog has migrated to a new comment system. New commenters can register directly in the comments section of any article. Returning commenters: your previous comments and display name have been preserved, but you'll need to reclaim your account by clicking "Forgot your password?" on the sign-in form, entering your email, and following the verification link to set a new password — this is required because passwords could not be carried over during the migration. For questions, contact tips@streetsblog.org.