Carpocalypse Now: MTA Releases Granular Bus Speed Data Showing Need for Congestion Pricing
Oh happy data.
The public now has a powerful new data tool to understand city bus speeds — broken down by route segments — which the MTA posted online on Tuesday that shows just how badly bus riders need congestion pricing.
Previously, the agency only published bus speeds for full routes — some of which run for miles through relatively traffic-free areas as well as congested zones. The new segmented data means advocates, reporters, data scientists and everyday people can understand where, exactly, buses are getting bogged down.
And in Manhattan, they are almost uniformly bogged down in the nation’s worse congestion — which would have been reduced by 17 percent had Gov. Hochul not paused congestion pricing on June 5.
“This [tool] definitely increases the ability to be more focused and say, ‘This is the particular area where this bus is having problems,’ and to be able to drill into that,” said Jehiah Czebotar, a transit and safe streets activist in Manhattan. “It puts advocates in the driver’s seat of being able to answer detailed questions.”
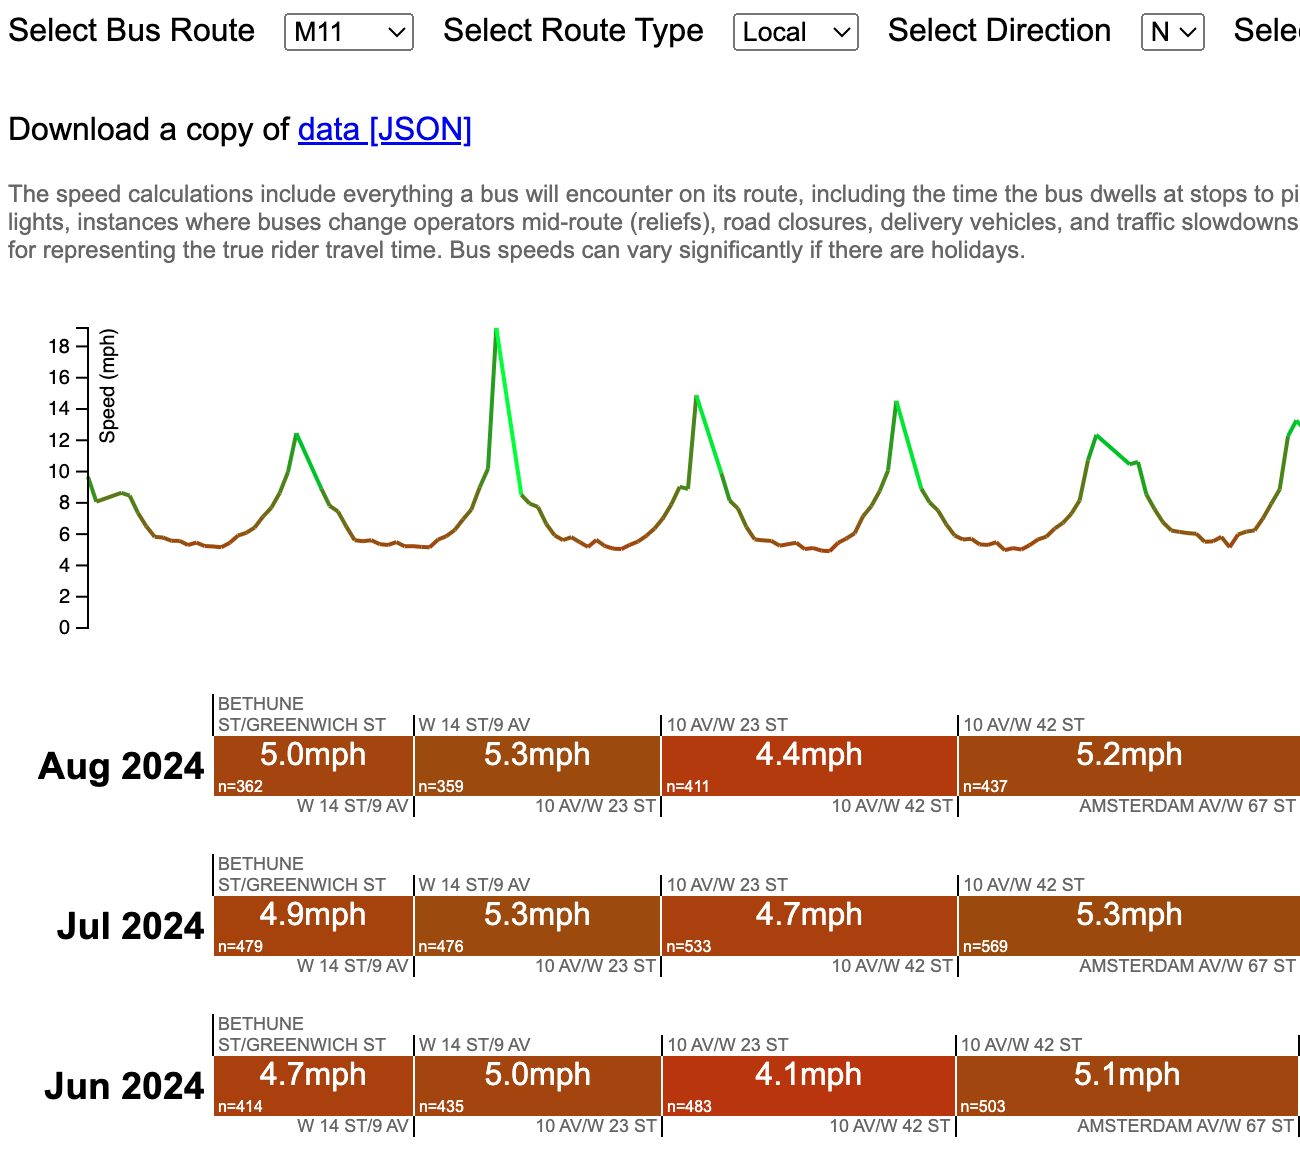
The data consists of a large batch of bus stops, bus routes, longitudes and specific times of the day. But Czebotar used it to create an analysis tool that allows people to pick a route and see how fast buses move among the various segments of its route, and at different times and days — information that previously was aggregated and, therefore, less granular.
“Now you can more easily answer questions like, ‘What are the speeds in the morning versus late at night?’ That information is available in much more detail than it used to be, so you can say on some routes, maybe changing the parking regulations for another hour could improve things,” said Czebotar. (Not to mention instituting a toll that would reduce tens of thousands of car trips daily.)
The agency’s route-level bus speed data will of course still be useful as a cudgel to show how buses remain mired in traffic — something that hasn’t changed much under two consecutive mayors. But the full route tool has some obvious limitations in that it’s impossible to know where buses got clogged up or even what time of day speeds are good or bad beyond vague “peak” and “off-peak” designations.
MTA and city officials already use the segmented data in public presentations — such as when the MTA recently displayed how bus riders south of 60th Street were suffering through brutally slow rides just before congestion pricing was supposed to begin (and then didn’t).
Using the new open data, Czebotar was able to show that the M11 specifically gets bogged down traveling between W. 23rd and W. 42nd streets as bus drivers need to contend with traffic headed to the Lincoln Tunnel.
The release of the bus segment data is part of a larger MTA effort to put the agency’s many streams of information to public use, in what the agency is calling an “open challenge” to create apps, written reports, data visualizations or even art to shed light on how people get around the city and region.
“We’re inviting anyone and everyone to tap into our massive open data sets and produce insightful and creative projects that shed additional light on the system that moves nearly five million New Yorkers every day,” said MTA Chief of Strategic Initiatives Jon Kaufman.
“Whether they help show how people get where they need to go more quickly, how they pay, or additional MTA budget transparency, we are excited to see what the community can create.”
To enter the challenge, members of the public can send an email to opendata@mtahq.org with the subject line “MTA 2024 Open Data Challenge Submission” by 11:59 p.m. on Friday, October 25, along with a complete submission form available on the MTA website and a 500-word description of their project.
The creator of the winning project will not only receive bragging rights, but a vintage piece of swag from the New York City Transit Museum, officials said.

Read More:
Streetsblog has migrated to a new comment system. New commenters can register directly in the comments section of any article. Returning commenters: your previous comments and display name have been preserved, but you'll need to reclaim your account by clicking "Forgot your password?" on the sign-in form, entering your email, and following the verification link to set a new password — this is required because passwords could not be carried over during the migration. For questions, contact tips@streetsblog.org.