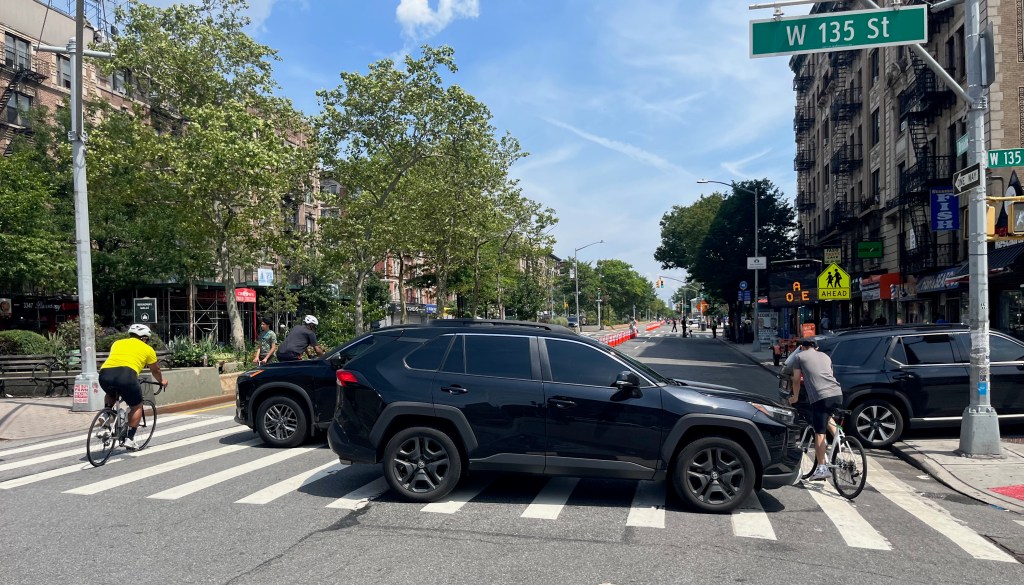
Komanoff Dissects New York City’s Car Baby Boom
U.S. Census data confirm what we suspected: New York City’s car population exploded in the past decade, even more than that of the suburbs.
From 2012 to 2021, the last year with available data, the number of passenger vehicles owned by residents of the five boroughs rose by 223,500, lifting the number of cars in the city from 1,853,000 to 2,077,000. That’s an increase of 12.1 percent.
Over the same period, the seven non-city “MTA counties” — Nassau and Suffolk on Long Island, and, north of the city, Westchester, Rockland, Putnam, Dutchess and Orange counties — added 228,700 vehicles. The numerical rise, a tad greater than the city’s, was much smaller in percentage terms, just 7.5 percent.
Worse, the human population growth in the city over the period was 1.4 percent, while the population growth in the suburbs was 3.3 percent.
The Census data further reveal that city residents’ increased buying and owning of automobiles predated the pandemic that began in early 2020. The average annual increment in New York City registered vehicles from 2019 to 2021, just shy of 30,000 — wasn’t a big departure from the 23,500 annual average gain from 2012 to 2019. In contrast, the suburbs underwent a boom in automobile ownership in 2020 and 2021, averaging annual increases of 71,500 owned vehicles versus just 12,200 per year in the prior seven-year period. (Some of the bump likely was from out-migration of Covid-fleeing city residents who brought cars with them and/or purchased more.)
New York City’s automobile-ownership surge wasn’t confined to one or two boroughs, as the graph above demonstrates. From 2012 to 2021, the number of registered vehicles grew by 52,000 in the Bronx, 59,000 in Queens and 66,000 in Brooklyn (notably, the largest among the state’s 62 counties). The increases in Manhattan and Staten Island were 23,000 each.
Percentage-wise, the number of registered vehicles in the Bronx grew by 22 percent, the steepest rise by far among the dozen downstate counties. Manhattan, Brooklyn and exurban Dutchess County were next, with 13 percent more vehicles in 2021 compared to 2012, according to the Census data.
NYC’s car-free majority is slipping
If these trends continue, New York won’t be a car-free-majority city much longer. The share of city households reporting zero motor vehicles in 2021, 53.9 percent, was down from 56.5 percent in 2012. Three boroughs — Bronx, Brooklyn and Manhattan — are still majority-car-free, but the share of car-free households dipped by two to three percentage points in every borough.
The city gained 171,100 net households over the nine years, according to the Census data. Strikingly, less than a tenth of that increase was in zero-car households. Even three-or-more-vehicle households, a rarity in the city, grew more. Manhattan, despite losing 9,100 households, now has 650 more three-or-more-vehicle households than it did in 2012, but 28,000 fewer car-free ones.
Eagle-eyed readers may be wondering whether the Census figures are compromised by the spreading contagion of out-of-state plates. I suspect not. Census data is drawn from anonymous surveying rather than DMV records, suggesting that vehicle ownership is reported accurately even if registrations are falsified.
What’s behind the car boom?
These disturbing trends call to mind the biblical parable of seven fat years. In New York City, the period from 2012 to 2019 was one of prosperity, at least as measured by traditional indicators. Yet save for the introduction of Citi Bike and some buildout of the city’s bicycle network, living here without a car was made harder, not easier.
Let us count the ways: Bus rapid transit never took flight. The 7-line extension and the new Second Avenue Subway together contributed just a couple of miles of track. A mere two of the city’s 25 subways lines were outfitted with modern digital signals permitting greater train frequency. City Hall indifference stymied full implementation of Fair Fares, the innovative program to cut fares in half for low-income families. Transit advocates fought like hell, but too often were forced into rear-guard campaigns to reverse the service cuts from the 2009-2010 aftermath of the financial crisis and hold the line on fares.
Equally important, nothing was done to make it costlier to own and drive cars. Then-Mayor Bill de Blasio repeatedly derided congestion pricing, and then-Gov. Andrew Cuomo ignored it until his abrupt August 2017 conversion — squandering time that could have been used to navigate the absurdly drawn out environmental review. Cratering gasoline prices beginning in late 2014 became an inducement to buy a first (or second or third) auto.
Likewise, reforming parking with curbside pricing never got a toehold, further emboldening New Yorkers to take the vehicle-ownership plunge. De Blasio handed out parking placards to tens of thousands of teachers. Uber’s ascendancy didn’t stem the tide; indeed, the ranks of city for-hire vehicle drivers more than doubled from 47,000 in 2013 to 103,000 in 2013, likely accounting for a goodly percentage of the overall 223,500 rise in five-borough registered vehicles during the seven-year period. Meanwhile, promises to dedicate new surcharge revenues from Uber and taxi trips in Manhattan to improve outer-borough transit went unfulfilled.
What to do?
No silver bullet can reverse the rising tide of car ownership. But antidotes abound: Getting congestion pricing in place, introducing curbside pricing, vastly expanding Citi Bike, finding durable new operations funding for NYC Transit, and extirpating MTA capital program waste are all essential and possible.
So are allied policies including upzoning a la Gov. Hochul’s housing compact, and a raft of opportunity-fostering, equality-enhancing policies from higher wages to higher taxes on extreme wealth.
None of this is hopeless. But the 2017-2019 window in which “breaking car culture” seemed within reach is gone, and won’t come back by itself. Per Sweeney Todd: the work waits.

Read More:
Streetsblog has migrated to a new comment system. New commenters can register directly in the comments section of any article. Returning commenters: your previous comments and display name have been preserved, but you'll need to reclaim your account by clicking "Forgot your password?" on the sign-in form, entering your email, and following the verification link to set a new password — this is required because passwords could not be carried over during the migration. For questions, contact tips@streetsblog.org.