New Report Shows Mayor Does Not ‘Get Stuff Done’ for Bus Riders, Cyclists
Maybe the mayor’s motto should be “Get some stuff done.”
The city has only completed 6.9 miles of its mandated 30 miles of protected bike lanes in 2022, according to a new count compiled by Transportation Alternatives — a devastating finding that comes as another advocacy group has revealed that the city has only completed two miles of the 20 miles of dedicated bus lane that it is also required to build this year.
In other words, using both the Transportation Alternatives tracker and the Riders Alliance tracker:
- The city’s 6.9 miles of protected bike lane mileage represents only 23 percent of the mileage it must build this year under the Streets Master Plan law passed in 2019.
- The city’s two miles of dedicated bus lane mileage represents only 10 percent of the mileage it must build this year under the Streets Master Plan law passed in 2019.
The biggest shortcomings are in the Bronx, as both trackers show many promises, but very little accomplishment, in the Boogie Down.
“The Bronx had the most to gain this year in terms of new protected bike lanes, so it’s a disappointment how practically none of these projects have been fully completed yet,” safe streets advocate Michael Kaess tweeted on Monday. “Time is running out.”
Given that bike and bus lanes aren’t typically built after the weather turns too cold, watchdogs don’t expect the numbers to change much between now and the end of the painting season. Some political observers see the problem as part of a larger failure of the Adams administration. But one activist simply called the bike and bus numbers beyond disappointing.
“For the future of our climate and the safety on our streets, protected bike lanes need to be a priority, but right now it doesn’t look that way,” said Elizabeth Adams, senior director of Advocacy and Organizing at TA. “We hope that the data displayed on our site provides the accountability needed for Mayor Adams and his team to get this done.”
It’s not a surprise that the Adams administration has failed to hit the benchmarks established by the Streets Master Plan, enshrined in law by the City Council in 2019, but was triggered to take affect only after former Mayor Bill de Blasio left office. In that administration’s waning days, the DOT told the Council that it lacked the resources to fully implement the law.
But under pressure from activists, Mayor Adams said he would boost the agency’s budget by $904 million over five years to not only carry out the mandates in the law, but expand upon them. But the agency has been beset by a high number of vacancies in its senior staff, plus low morale and allegations of political interference in projects, making it unclear if the agency has been able to spend the money, as Streetsblog reported last week.
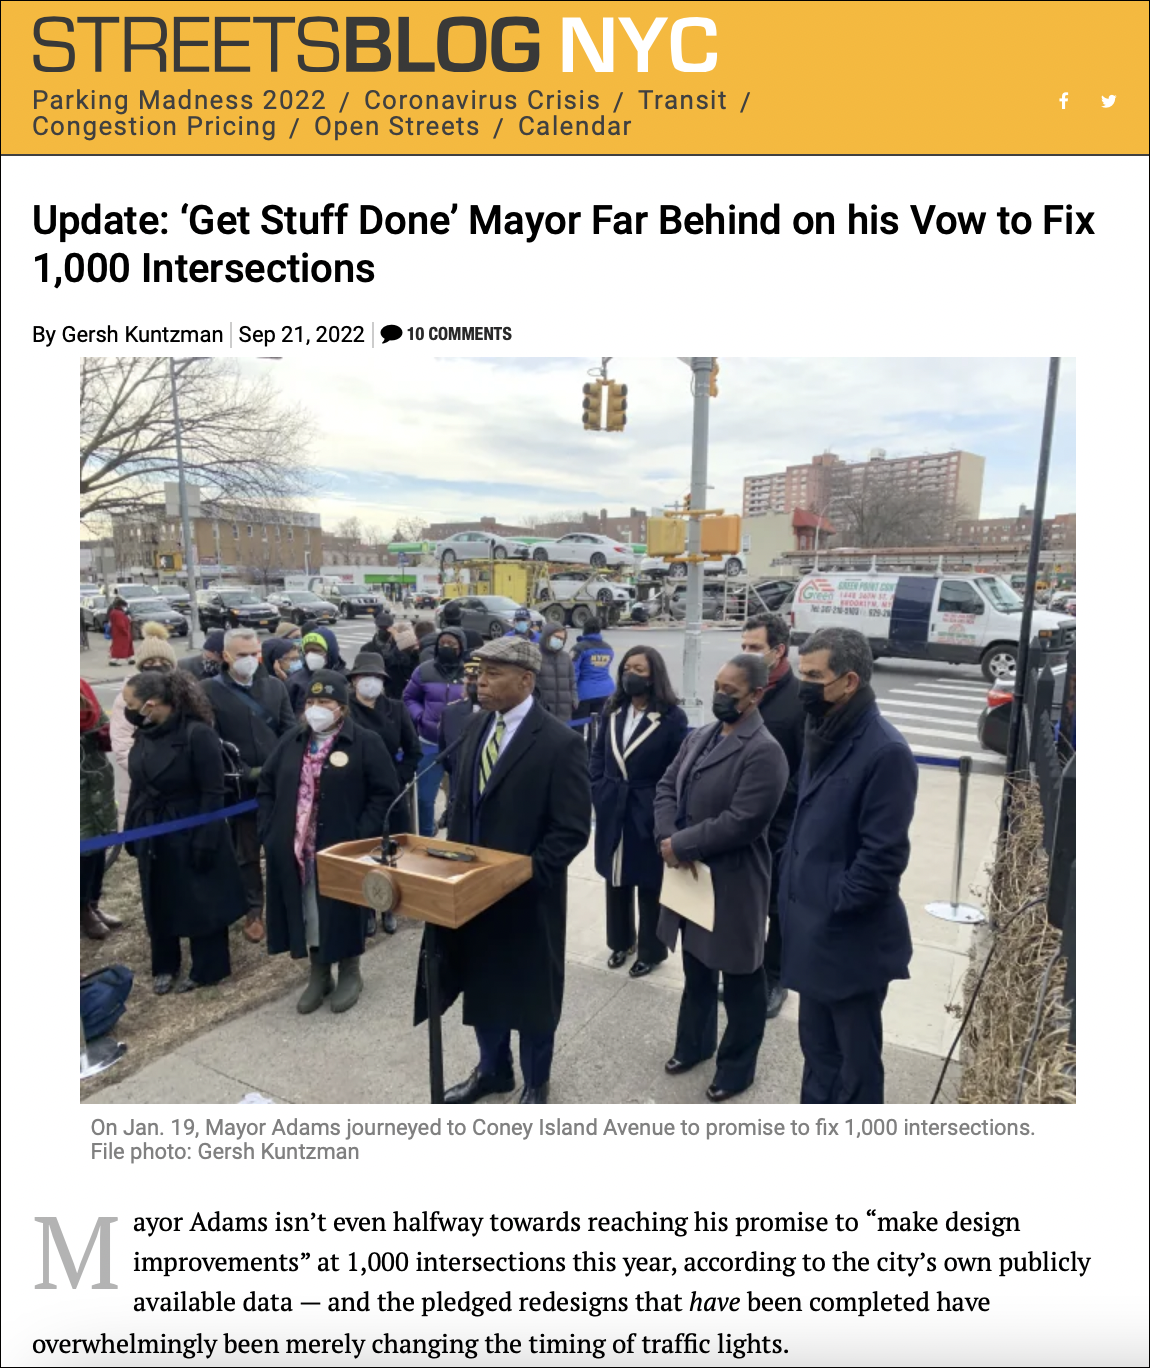
And the TA and Riders Alliance trackers are also no surprise, given that the city is also far behind on its promise to redesign 1,000 intersections this year for safety. As Streetsblog reported recently, the agency has redesigned fewer than 400 intersections — and the vast majority merely had the signal timing changed.

That report was based entirely on the city’s public data feeds. But protected bike lanes are not posted on any public dataset or published in any city-hosted site, so TA said its map was compiled “based on DOT presentations to community boards, social media posts, and on-the-ground reports.”
The group said that the lack of public data makes it difficult to hold public officials accountable and could lead to undercounts — but blamed the city.
“This data should be provided by the city, in one place, easily understandable to the public. But this doesn’t exist,” Elizabeth Adams said. “We took it upon ourselves to create this tracker, with the help of local activists, to clearly visualize the data, and hold the administration accountable.”
That’s similar to why Riders Alliance created its bus lane tracker.
“The Adams administration must pick up the pace to meet the legal mandate of the Streets Plan — 20 new bus lane miles by year’s end versus just two today,” said the group’s spokesman, Danny Pearlstein. “The mayor has yet to deliver for riders on big projects like Fordham Road and Northern Boulevard, both of which are stepping stones to Flatbush Avenue, which is on the boards for next year. What began as a marathon in the spring must now become a sprint as painting season ends once the cold takes hold.”
But not all advocates agree that the Streets Master Plan is the way to go. After the Mayors Management Report revealed similar shortcomings as the TA and Riders Alliance trackers earlier this month, Jon Orcutt of Bike New York has long called for better bike lanes rather than simply more bike lanes.
But the “numbers that matter” in Bike New York’s tweet are also lagging under the Adams administration. Bike mode share remains flat and crashes are up.
According to city statistics, there were 23,418 injury-causing crashes, injuring 3,188 cyclists, 4,421 pedestrians and 24,269 motorists between January and August 2021. During the same period this year, there were 24,159 crashes that caused injuries (3 percent more), injuring 3,328 cyclists, 5,475 pedestrians and 23,727 motorists (or 2 percent more people).
The NYPD’s traffic stats show that injuries to pedestrians are up 20 percent this year and injuries to cyclists are up 4 percent.
A spokesman for the Department of Transportation said the advocacy groups’ bike and bus lane trackers are inaccurate.
“Mayor Adams has made a historic $900-million investment into the NYC Streets Plan and we are focused on working toward its aggressive targets to deliver a safer, healthier, and more sustainable city,” said the spokesman, Vin Barone. “The data in the tracker is not representative of the mileage we’ve finished so far. It is important to remember DOT completes the bulk of our bus and bike lanes toward the end of the year, in concert with construction season and DOT’s robust public outreach.”

Read More:
Streetsblog has migrated to a new comment system. New commenters can register directly in the comments section of any article. Returning commenters: your previous comments and display name have been preserved, but you'll need to reclaim your account by clicking "Forgot your password?" on the sign-in form, entering your email, and following the verification link to set a new password — this is required because passwords could not be carried over during the migration. For questions, contact tips@streetsblog.org.