On the eve of today's opening of the congestion pricing public comment period, we asked Charles Komanoff to do what he does best: Crunch the numbers and show that our region desperately needs congestion pricing. Here you go.
This post will demonstrate that even if traffic volumes into the Manhattan Central Business District fell sharply from pre-pandemic levels, congestion pricing would still be slam-dunk justified. Why? Because the tolls still would just be a fraction of the costs of the congestion averted by each trip that the toll priced off the road.
In new analysis this week, I found that vehicle entries to the CBD could subside by a whopping 25 percent — an extreme scenario that would cut by 40 percent the cumulative traffic slowdown caused by any individual trip — and the societal cost of that slowdown would still be several times greater than any conceivable toll that will emerge from the MTA’s congestion-pricing sausage-making process.
I find the mathematics fascinating. They confirm that congestion costs are super-sensitive to traffic volumes, exactly as you’d expect in a hyper-congested environment like Manhattan south of 60th Street. But even I started wondering why bother with the math, in light of new figures I pulled today from MTA Bridges and Tunnels’ fabulously detailed data portal for its seven bridges and two tunnels.
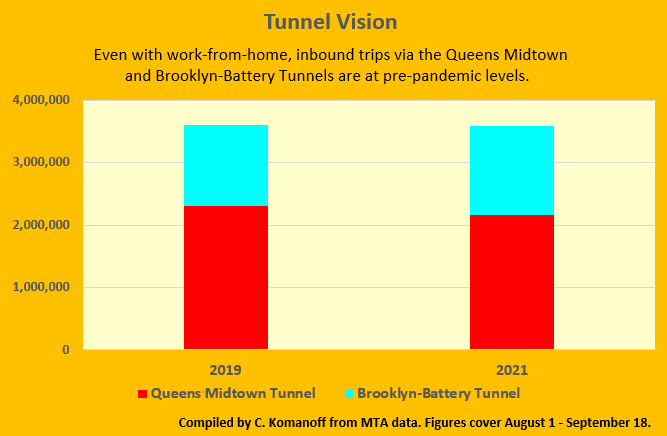
Here’s what I found: Comparing the past seven weeks with the same period from two years ago, the combined inbound volumes on the MTA’s Queens-Midtown and Brooklyn-Battery tunnels — the lone MTA crossings that funnel cars directly into the proposed charging zone — are essentially unchanged.
From Aug. 1 to Sept. 18, 2021, vehicle entries on the two tunnels were a minuscule 0.5 percent less than in the same 49-day period in 2019. And while the 2021 figures were inflated somewhat by drivers diverting from the Brooklyn Bridge, which gave a vehicle lane to bicycles, city DOT’s numbers for its East River crossings tell the same tale: Over the six months from March through August, vehicle volumes entering Manhattan on the four East River bridges are essentially unchanged as well — up 0.3 percent from 2019. (I thank the DOT comms staff for quickly supplying the monthly data I consolidated here.)
OK, maybe I’m the last person to figure out that, traffic-wise, it’s 2019 all over again in the heart of Manhattan. Jose Martinez of The City had a superb story, "Back to Gridlock," along that line two months ago. But he and other commentators sometimes stirred non-CBD traffic volumes into their data stew, so I couldn’t be completely sure. Even the new data here only cover East River crossings and omit the crucial volumes flowing into the charging zone across 60th Street.
But whether or not those north-south vehicle entries have rebounded 100 percent, the overall picture is unmistakable: traffic volumes into the Manhattan Central Business District are at or close to their pre-pandemic levels.
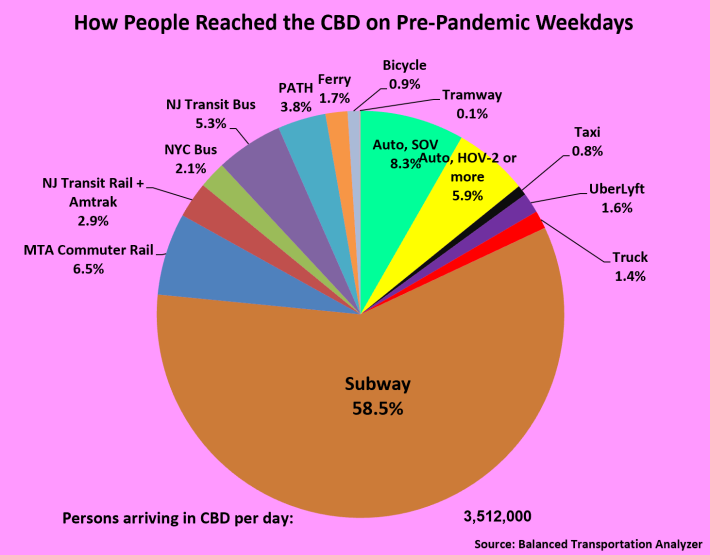
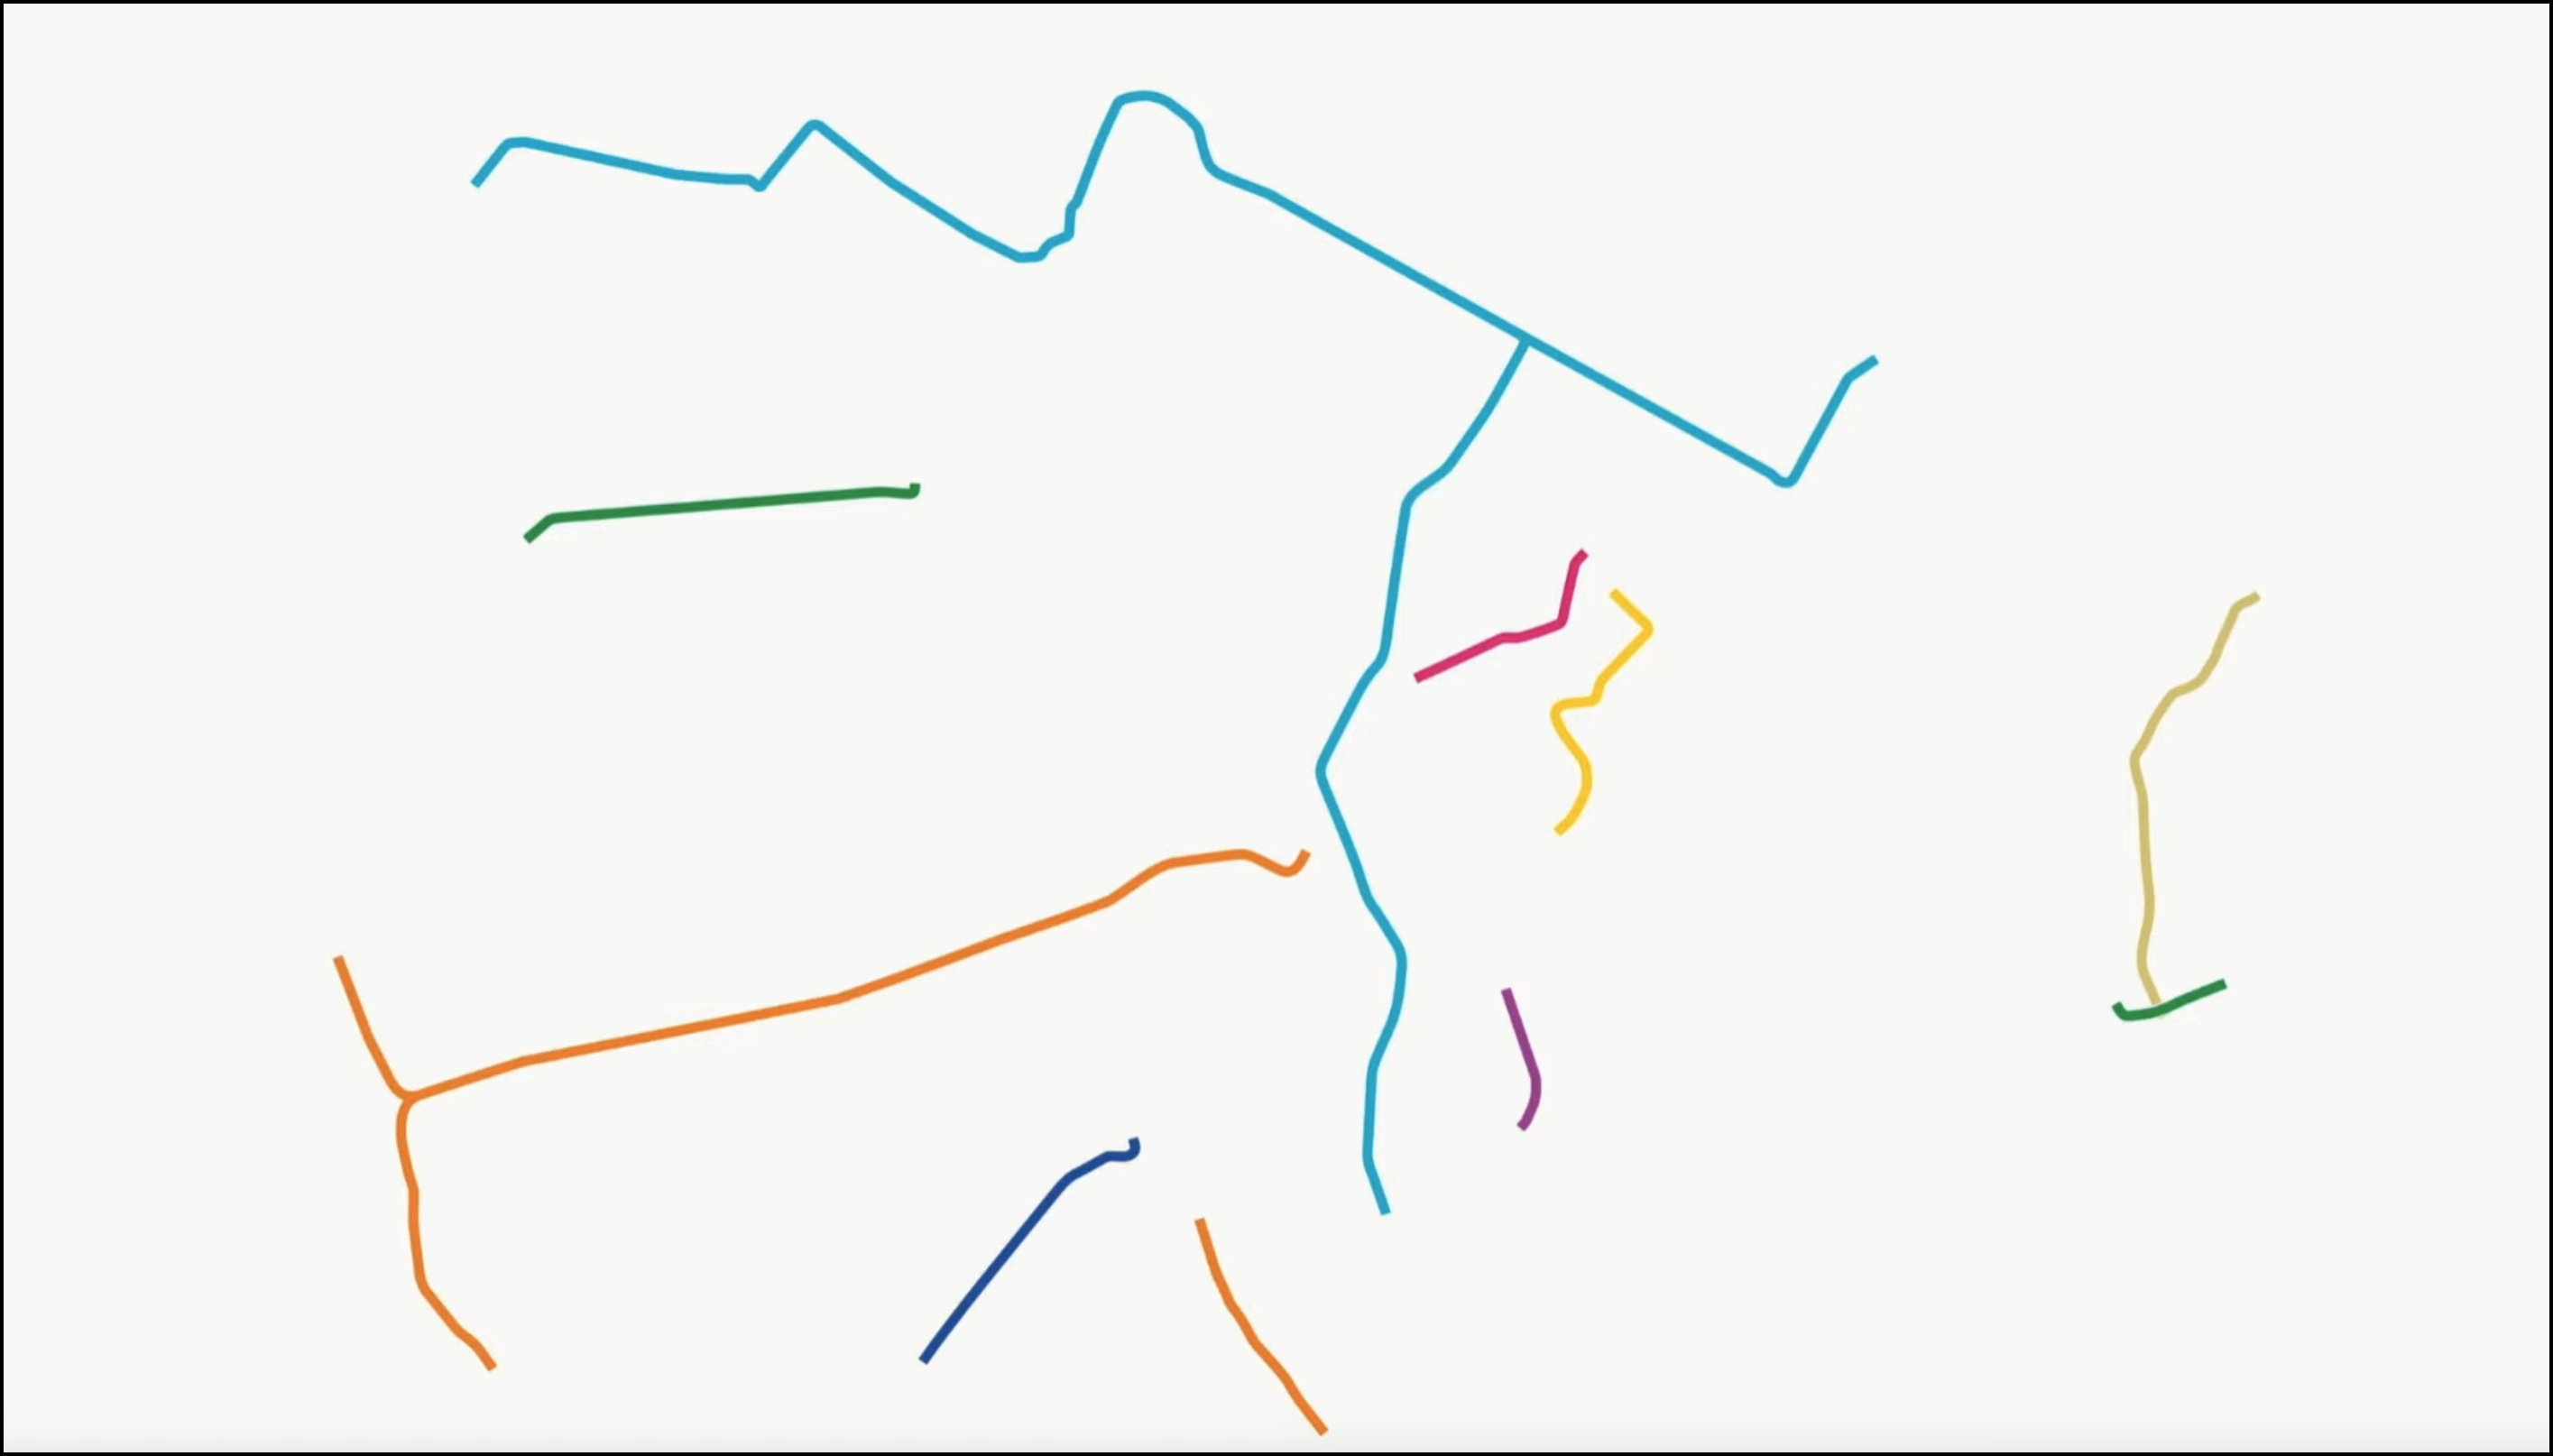
How can that be, with most office towers still depopulated and so many workers working from home? It’s actually pretty simple. Prior to Covid-19, mass transit trips to the CBD outnumbered car commutes by 4 or 5 to 1 (see pie chart above). Even with severely shrunken overall travel volumes, a substantial mode-shift from trains and buses to autos would suffice to keep auto travel afloat. And that’s what we got.
And, to pirate a phrase from Marx (Karl, not Groucho), don’t forget the “reserve army” of CBD-bound drivers: car owners who ordinarily don’t drive to Manhattan on account of the traffic but who rush in as soon as a bit of vacant (and unpriced) road space appears outside their windshields. That army has been swelled by the 100,000 or more additional NYC car registrations that Crain’s Amanda Glodowski spotted in DMV data over the summer. Throw in the NYPD’s cynical abdication of parking and other traffic rule enforcement and it’s no surprise that even in ailing Manhattan, car volumes have come roaring back.
How much does one trip’s congestion cost everyone else?
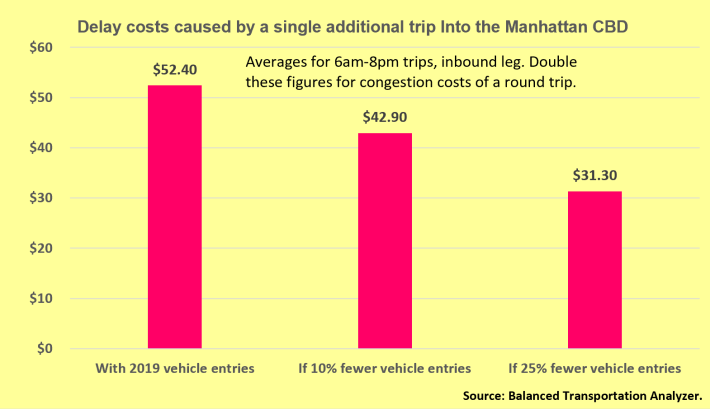
Now, the moment you’ve been waiting for: the bar chart with my estimates of the societal delay costs from an additional auto trip into the proposed congestion pricing zone.
There are three takeaways:
- First, those costs shrink faster than the assumed reduction in trip volumes, reflecting the geometric relationship between traffic levels and congestion costs.
- Second, the rate of cost shrinkage slows as more trips disappear, demonstrating that we don’t need to remove many trips to materially improve traffic flow.
- Third, and most important: the congestion costs caused by any one trip are a multiple of any conceivable toll on that trip. At 2019 traffic levels — which, as noted, are back in force — a single inbound trip between early morning and mid-evening imposes more than $50 worth of delays, on average, on other motor vehicle users: drivers, passengers, for-hire vehicle users, truckers, tradespeople with vans, and, of course, bus riders. Yet that same trip is unlikely to be charged as much as 10 bucks. (Remember, these figures pertain to just the inbound legs of two-way trips.)
And the dollar costs in the chart don’t include the many types of pollution (air, climate, noise) from that trip or its increment to the ever-present dangers New Yorkers face of being driven into the hospital or the morgue. A one-way peak congestion toll of $8 or $10 isn’t a burden, it’s a bargain.
Streetsblog contributor Charles Komanoff is an internationally recognized expert on congestion pricing and other mobility issues. He also runs the Carbon Tax Center. Follow him on Twitter at @komanoff. Data and calculations in this post are in the Delays, Travel and MTA Crossings tabs of Komanoff's downloadable Balanced Transportation Analyzer (9 MB Excel file).
