Streetsblog Gets Action: NYPD Restores Missing Bike Injury Data From TrafficStat

They’re back … in all their disgusting clarity.
Hours after Streetsblog reported that the NYPD had inexplicably removed statistics on bike injuries from its online TrafficStat database, the agency restored the numbers — though police spokespeople refused to say why the stats were taken down in the first place.
A police spokeswoman thanked Streetsblog for alerting the agency to the mysterious disappearance of the bike injuries stats, but did not respond to multiple requests for comment about why they were removed in the first place.
“Thank you for bring (sic) this to our attention,” said the spokeswoman. “The issue is resolved and the data is available.”
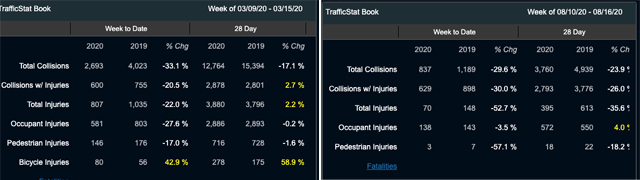
Now that the data is back up, readers can learn that bike injuries citywide are down about 5 percent so far this year, compared to the same period last year. But injuries are up slightly in the following NYPD patrol boroughs:
- In Brooklyn North (which comprises the neighborhoods of Bushwick, Williamsburg, Greenpoint, Downtown Brooklyn, Bedford-Stuyvesant, Clinton Hill and Fort Greene), injuries are up just .2 percent for the year, but are up 11 percent between mid-July and mid-August, compared to the same period last year.
- In Manhattan North (which is the borough above 59th Street), injuries are up 2 percent this year, and are up 20 percent between mid-July and mid-August.
- In Queens North (which comprises the neighborhoods of Long Island City, Ridegwood, Elmhurst, Bayside, Astoria, and Jackson Heights), injuries are up 1 percent for the year, but 19 percent between mid-July and mid-August.
- In Staten Island, injuries are up 13 percent for the year, and 22 percent between mid-July and mid-August.
The injuries in the Bronx are the most glaring. Streetsblog has long documented that the city has failed to build out a protected bike lane network in the Boogie Down, where two cyclists were killed just days apart back in June. As a result, 432 cyclists have been injured this year in the borough, compared to 322 over the same period last year — an increase of 33.9 percent, according to NYPD’s traffic stat, even as car travel was greatly depressed for a big segment of that time period.
And injuries to cyclists in The Bronx are up 41 percent between mid-July and mid-August compared to the same period last year.
There’s no surprise why those cyclist injury stats went up so dramatically in the last few weeks: car traffic is going up, too. Between mid-June and mid-August, the total number of vehicle miles traveled in the five boroughs increased from 116,220,000 to 190,700,000 — an increase of 63 percent.
The missing stats come after less than a month after the advocacy group Bike New York raised concerns about the way data relating to traffic safety and traffic-related deaths are kept and shared with the public, demanding the city reconfigure its Vision Zero View website, which is managed by DOT.
“Provide a clearer picture of traffic safety issues and trends by providing more information about fatal and injury crashes on the city’s Vision Zero View website,” the July 29 letter says. “It could serve a stronger role informing the public, elected officials, media and other constituencies about the city’s traffic safety progress and challenges if it provided additional, easy-to-recognize data points.”
Specifically, the letter says, since DOT Commissioner Polly Trottenberg has said that trucks were involved in a disproportionate number of cyclist and pedestrian fatalities last year, the data should be organized to clearly show that.
“City initiatives like the Green Wave bicycle safety plan spotlighted trucks as a problem in accelerating cyclist deaths in 2019, but this trend is not reflected in any way on Vision Zero View,” the letter says.

Read More:

Streetsblog has migrated to a new comment system. New commenters can register directly in the comments section of any article. Returning commenters: your previous comments and display name have been preserved, but you'll need to reclaim your account by clicking "Forgot your password?" on the sign-in form, entering your email, and following the verification link to set a new password — this is required because passwords could not be carried over during the migration. For questions, contact tips@streetsblog.org.