Car drivers are moving around in their 3,000-pound steel cages again and, as a result, cyclists injuries were up 7 percent last month, according to NYPD statistics.
The 506 injuries to bike riders citywide between June 14 and July 12, versus 473 over the same period last year, shows what happens when car traffic increases: there are more cycling injuries, which, like car traffic, have been down by double-digits for most of the year.
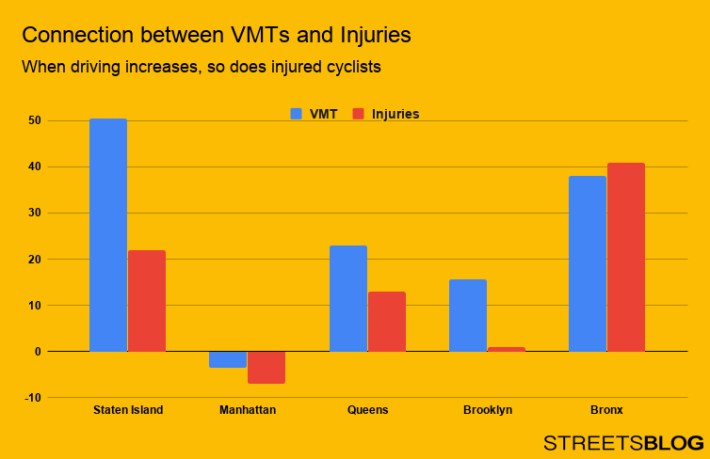
The borough-by-borough numbers show an uncanny link between driving and cyclist injuries:
- The overall increase was the worst in The Bronx, where injuries to cyclists struck by vehicles were up 41 percent last month — which makes complete (and horrifying) sense, given that the total vehicle miles traveled in the borough were up 38 percent over the same period.
- In Queens, cyclist injuries were up 13 percent last month — and VMTs were up 23 percent.
- In Staten Island, cyclist injuries were up 22 percent — and VMTs were up 50 percent.
- In Brooklyn, injuries are up only 1 percent — but also as a result of more driving (VMTs were up 15 percent).
- And in Manhattan, cyclist injuries are down 7 percent — but total miles driven was also down 3.5 percent.

The number of injuries last month also follows another disturbing pattern: there are more injuries in areas with poor bike infrastructure.
In The Bronx, six of the borough's 12 precincts account for 71 percent of the 86 cyclist injuries that occurred last month.
The borough has very little bike infrastructure — and almost none on roadways in the precincts in question: 48th, 45th, 46th, 49th, 40th and 52nd.


