A Reminder: Pricing Car Trips to Fund Transit Is Progressive Policy

Timed to coincide with this weekend’s car-free events, the Tri-State Transportation Campaign has released a fact sheet on car ownership rates in NYC.
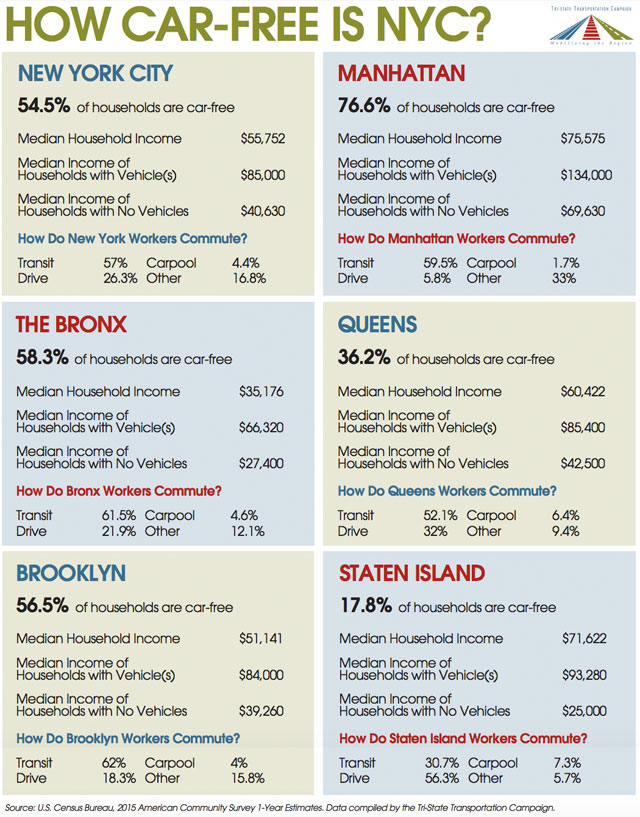
Compiled from 2015 U.S. Census data, Tri-State’s fact sheet shows that most households citywide don’t own a car, car-owning households tend to be more affluent than car-free ones, and the vast majority of New Yorkers don’t drive to work. These facts have remained constant for years, but it’s been some time since anyone compiled an update with current information.
Here’s the full fact sheet:
A few takeaways:
- 54.5 percent of households citywide are car-free.
- Citywide, the median income of households with cars is more than twice as high as the median income of car-free households.
- The income disparity between car-owning and car-free households is stark in every borough, and most pronounced in Staten Island, where the median car-free household earns 73 percent less.
- Manhattan has the highest share of car-free households (76.6 percent), and Staten Island the lowest (17.8 percent).
- Many car owners don’t drive to work. Though around 45 percent of households citywide have a car, only around 30 percent of workers drive or carpool to work.
- The majority of workers in every borough take transit to their jobs — except in Staten Island, where 56 percent drive.
The fact sheet is an update to those TSTC released in 2007 to bolster the case for congestion pricing. Since then, politicians have continued to cite the mythologized car-owning working stiff to oppose toll reforms that would cut traffic and fund transit. That narrative still doesn’t mesh with reality.
There have been small fluctuations in the car ownership rate since 2000, when it stood at 44.3 percent. While the current rate is about a percentage point higher, it’s down from 46 percent in Census data collected between 2005 and 2009.

Read More:
Streetsblog has migrated to a new comment system. New commenters can register directly in the comments section of any article. Returning commenters: your previous comments and display name have been preserved, but you'll need to reclaim your account by clicking "Forgot your password?" on the sign-in form, entering your email, and following the verification link to set a new password — this is required because passwords could not be carried over during the migration. For questions, contact tips@streetsblog.org.