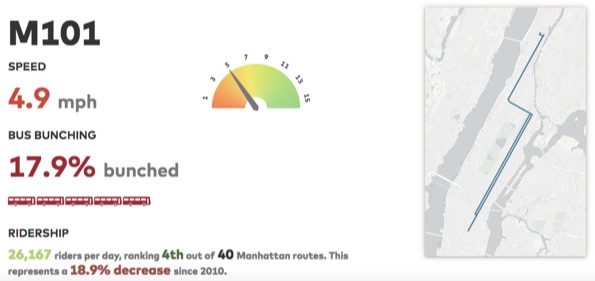
Just how bad do bus riders have it in NYC? Today the transit advocates with the Bus Turnaround campaign launched a web site that lets you look up any route in the system and see how it performs. Spend a few minutes on the site and you'll see why ridership has fallen 16 percent citywide since 2002.
There's a fun (if you can call it that) visualization of the headaches a New Yorker must deal with on a typical bus trip -- unpredictable arrivals, slow boarding, frequent stops -- and a hypothetical look at the same trip on an improved system where buses are on time, direct, and don't get bogged down in traffic.
The main feature of the site, though, is a report card for every route, with data on bus speed, bunching, and ridership. You can look up the buses you ride on regular basis or click on routes anywhere in the city. One pattern that emerges -- the routes that the most people rely on are doing the worst.
The report cards are based on MTA Bus Time information -- a testament to the power of open data.
The Bus Turnaround website was announced at a morning rally where advocats, electeds, and straphangers called for the MTA and NYC DOT to make citywide improvements to the bus network, ahead of a City Council hearing on the subject. Stay tuned for coverage of the hearing later today.


