DOT released the final installment of its pedestrian safety plans yesterday with a report for Staten Island [PDF], where the nature of pedestrian crashes is different than in the other boroughs.

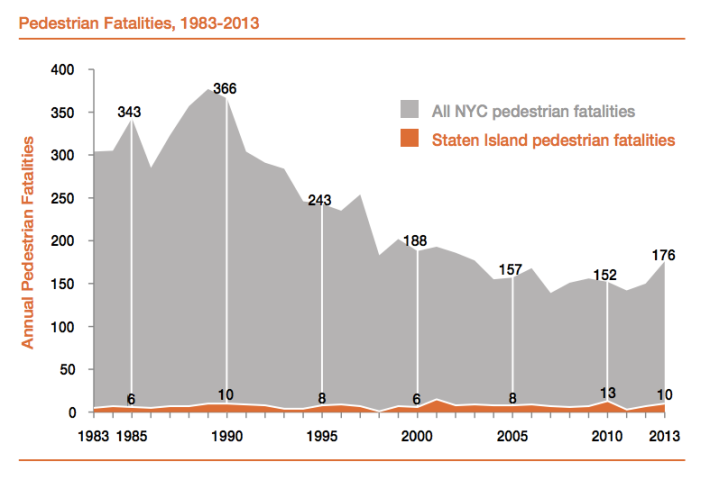
Over the past three decades, the city as a whole grew approximately 19 percent while the number of pedestrian fatalities was cut in half. On Staten Island, while the population has increased at a more rapid clip of 30 percent, pedestrian fatalities have not declined at all.
On average, about 40 pedestrians are severely injured and seven are killed on Staten Island streets each year. The borough's rate of 1.4 pedestrian deaths per 100,000 residents is lower than the Bronx, Brooklyn, Manhattan, or Queens.
But that doesn't mean, as Transportation Commissioner Polly Trottenberg told the Advance, that "Staten Island is by far the safest borough." Because people don't walk as much in Staten Island as they do in other boroughs, it's difficult to compare to other parts of the city -- but the risk of getting around on foot is still substantial.
DOT's report notes that most of Staten Island is auto-dependent, with 82 percent of households owning at least one car, almost double the citywide average. Two-thirds of Staten Islanders drive to work, more than double the citywide rate.
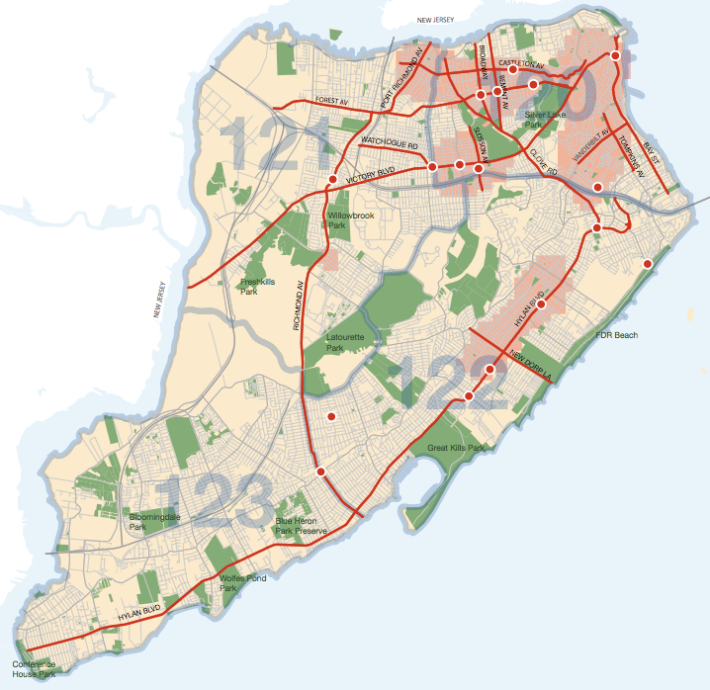
The North Shore is less car-dependent than the rest of Staten Island, and that's where pedestrian deaths are concentrated. The area east of the Bayonne Bridge and north of the Staten Island Expressway accounts for about 45 percent of the borough's pedestrian fatalities and serious injuries, but only 18 percent of its land area. (Outside of the North Shore, Hylan Boulevard is another danger zone.)
Here are more factoids from the report:
- Afternoons and evenings are deadly, with four in five Staten Island pedestrian fatalities occurring between 3 p.m. and 9 p.m., compared to 31 percent citywide.
- Almost two in three Staten Island pedestrian fatalities are on arterial streets. DOT identified 16 priority corridors that make up just 6 percent of the borough's street network -- but were the site of 40 percent of pedestrian fatalities and 54 percent of all pedestrian deaths or serious injuries.
- When combined with priority intersections and areas, priority locations cover just more than half of all pedestrian fatalities and 72 percent of all pedestrians killed or seriously injured.
- 45 percent of Staten Island pedestrian deaths occurred mid-block, higher than the citywide rate of one in three.
- Nine in ten Staten Island pedestrian fatalities, compared to 68 percent citywide, were inflicted by someone driving a private car. Dangerous choices by drivers are the primary cause or a contributing factor in 67 percent of Staten Island pedestrian fatalities.
- Seniors aged 65 and older comprise 14 percent of Staten Island’s population but 25 percent of its pedestrian deaths.
The top Staten Island complaint on DOT's Vision Zero map was speeding, at 26 percent of all complaints, followed by failure to yield at 20 percent and red light running at 10 percent.
While Staten Islanders may be more car-dependent than other boroughs, they are very interested in traffic calming: DOT says that when it launched the Neighborhood Slow Zone program in 2012, 43 of 97 total requests came from Staten Island.


