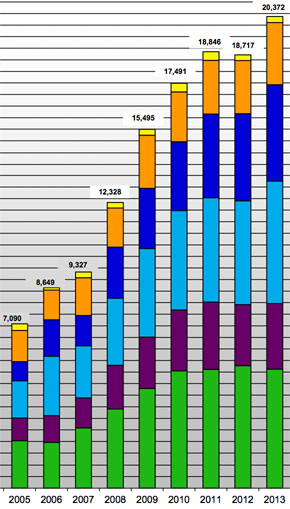
Bicycling in the New York City core continues to rise, according to the latest counts from the city. But the methodology NYC DOT uses to measure year-over-year changes in cycling is also showing its age. To get a clearer picture of citywide cycling activity, DOT will have to start doing annual counts in more places.

DOT's screen line bike count shows cycling increased across the boundaries of the Manhattan central business district 8 percent in 2013 [PDF]. (The counts aren't on the DOT website and the press office didn't respond to Streetsblog's request for them, so we got them from an unauthorized source.)
DOT conducts the screen line count by tallying cyclists several times between April and October at the Hudson River Greenway at 50th Street, the four city-owned East River bridges, and the Staten Island Ferry terminal. The great thing about it is that the agency has used the same methodology, more or less, since 1985, so it now provides a 30-year trendline.
You can tell from the historical record that the city's investment in safer bikeways has paid off -- the screen line count has nearly tripled since 2005.
Citywide measures of cycling, meanwhile, also show upward movement, but not as much as the screen line. The Census (which has its flaws) shows a 40 percent increase in bike commuting between 2007 and 2012, and in an annual Department of Health survey, the number of New Yorkers who report biking several times per month increased 16 percent from 2007 to 2012.
In other ways, though, the screen line appears to undercount cycling -- namely, it's not capturing all of the growth due to bike-share.
Last October, DOT counted bike-share trips and non-bike-share trips at various locations throughout the Citi Bike service area, which covers roughly the same part of the city as the screen line. Combined with a survey that showed a small proportion of bike-share trips were substituting for personal bike trips, the results indicated that there were 36 percent more bike trips in the service area than there would have been without Citi Bike.
But if you look at the annual change in the screen line after Citi Bike trips plateaued last July, the increase is significantly smaller than 36 percent. The screen line count for August, September, and October of 2013 was just 13 percent higher than the count for the same months in 2012. The screen line counts apparently don't capture an accurate proportion of bike-share trips, maybe because a relatively small share of those trips involve biking over a bridge.
The screen line count is a great metric and the city should keep tracking it. But it's increasingly clear that the screen line alone is insufficient: It's not conveying enough information about bicycling trends throughout the city -- either inside the screen line boundary or outside.
The bike-share-enhanced counts from last October were a welcome addition -- a new way to estimate total cycling activity in the city core. It would be good to see those counts continue on an annual basis.
More important, though, is to fill in the gaps in what we know about bike activity outside the core. DOT already does plenty of bike counts outside of Manhattan on a project-by-project basis (see, for instance, this presentation on the Pulaski Bridge). But as of yet there are no annual, standardized bike counts in the other boroughs that can be used, like the screen line counts, to assess year-over-year changes.
Mayor de Blasio's goal for bicycling is to achieve a 6 percent mode share citywide. To do it, his DOT will have to make biking safer in parts of the city far from the screen line. And to measure progress and stay on track, DOT will have to start doing annual bike counts on streets in Upper Manhattan, the Bronx, Queens, Brooklyn, and Staten Island.


