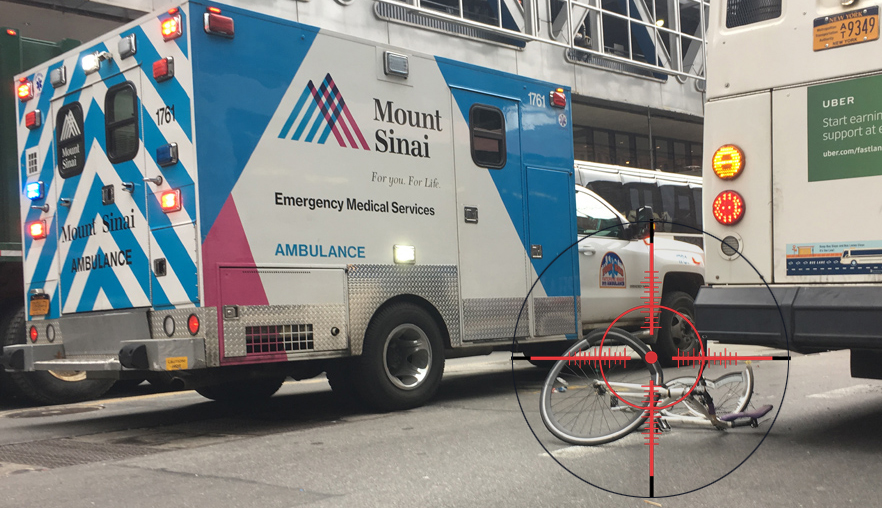
The Times’ good-news story this morning, “No Riders Killed in First 5 Months of New York City Bike-Share Program,” could almost have been written a year ago. In fact, it was, sort of, in this space. In June 2012, Streetsblog published my piece pooh-poohing predictions of looming traffic carnage. We followed that with a similar post as the curtain was going up on bike-share in May.

We weren’t exactly rolling the dice with those posts. We knew that there was already so much cycling in New York City without Citi Bike that even a hugely successful bike-share program would only register across the five boroughs as a minor uptick. Citi Bikers would have to be incredibly reckless, or luckless, or both, for their modest boost to overall NYC cycling to translate into the spate of deaths that the naysayers were forecasting.
To see why the absence of Citi Bike fatalities and the paucity of serious injuries have been no, er, accident, we’re going to pry open some numbers -- comparing injury rates and cycling levels for Citi Bike and NYC cycling as a whole. (Injuries are a better lens than fatalities because they’re orders of magnitude more common and, thus, less subject to random fluctuation.)
From May 27 through November 1, a period spanning 158 days, Citi Bike users racked up nearly 9.8 million miles, according to NYC Bike Share, or an average of 62,000 per day. In contrast, during all of 2012, total city cycling averaged 1.6 million miles a day, according to my estimates. That figure has been criticized as too generous (I’m working on a new estimating approach, but it’s months from fruition), so let’s knock it down to an even million. Then for each day in 2012, all NYC cyclists racked up 16 times as many miles as have Citi Bikers on each day to date.
Now let’s compare injuries. According to the Times’ Matt Flegenheimer, city authorities tabulated 3,675 bicycle-vehicle collisions in 2012, or 10 per day. (I don’t have 2012 injuries, so Flegenheimer’s collision figure, which he shared with me in researching his story, will have to do.) Today Flegenheimer reported “about two dozen [Citi Bike] injuries” in the program’s first 158 days. That’s a daily rate of 0.15 Citi Bike injuries, which is 66 times less than overall NYC bike injuries.
We now combine injury rates and mileage rates. If Citi Bike riding is 1/16 as prevalent as overall city cycling, while its injury frequency is 1/66 as great, then Citi Bike’s rate of miles-per-injury is around four times that of “regular” cycling. (Replace my “conservative” 1 million mile daily figure for city cycling with my published 1.6 million, and the per-injury mileage ratio of 4.1 becomes a still-impressive 2.6.)
The next question is why -- why are Citi Bike riders able to average about four times as many miles per injury-crash as other NYC cyclists? Here are five possible hypotheses:
- Safety in numbers
- Other differences between the bike-share area and NYC
- Differences between Citi Bikes and regular bikes
- Differences between Citi Bikers and regular bikers
- The Citi Bike imprimatur
Safety in numbers: Far and away the biggest reason for the observed three- or four-fold difference in injury rates, in my view, is safety in numbers: the tendency of drivers to become more mindful of cyclists’ presence and more respectful of their rights when cyclists are more numerous and are an expected part of the road environment.
Some analyses have inferred a "0.6 power law," meaning the distance or time that a given cyclist can ride without being struck by a driver rises with the 0.6 power of the increase in cycling. Thus, if “Zone A” has five times as much cycling as “Zone B,” the number of miles between a cyclist’s crashes with a vehicle should be “five raised to the 0.6 power,” or 2.6 times, as great in Zone A as in Zone B. While I don’t know relative cycling levels in the bike-share area vs. citywide, a factor of five may be a decent approximation. If so, then the two- to three-fold difference in miles-between-crashes associated with safety in numbers would explain most of the observed difference in injury rates between Citi Biking and regular cycling.
Other differences between the bike-share area and NYC: Naturally occurring lower speeds in the Manhattan Central Business District and West Brooklyn, dictated by street layout and congested traffic, should reduce crash rates.
Citi Bike differences: Compared to the average bicycle in service across New York City, Citi Bikes are slower, are better lit and have more reliable brakes.
Citi Biker differences: Far from inhabiting the hapless tourist/newbie tabloid stereotype, people riding Citi Bikes seem mindful of the challenges inherent in city riding. As for veteran riders using Citi Bikes, some have spoken of an “ambassador effect” inspiring them to be more observant of road rules.
The Citi Bike imprimatur: Based on scattered anecdotal evidence, the fact that bike-share is a publicly provided amenity and an actual part of municipal infrastructure may be spilling over into increased acceptance of the blue bikes and the people riding them.
I had hoped to conclude with an estimate of the a priori probability that on May 27, when the first Citi Bikes rolled, the Times could have confidently run its “no fatalities” headline as a prediction for the first 158 days of bike-share. Unfortunately, Nate Silver is off riding River Road today, and I promised to reel him in before he crests the Alpine Approach Road. So we’re out of time. We’ll run that number next time.


