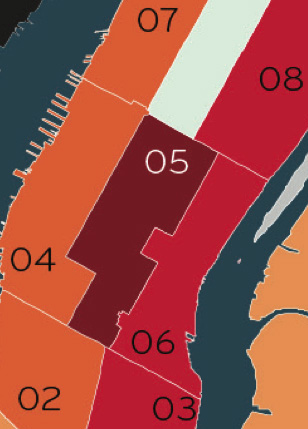
On Monday Transportation Alternatives released a report tallying pedestrian-involved crashes in each of the city's community board districts, based on numbers from the state Department of Motor Vehicles, between 1995 and 2009. Not surprisingly, the data reveal that the most collisions occurred in Midtown Manhattan, where high-density auto and foot traffic led to 8,604 crashes in District 5 alone.
The TA study, along with the relaunch of CrashStat and the (however convoluted) release of crash data from NYPD, have raised the profile of the city's traffic violence epidemic. This is undoubtedly a positive development, and one that will hopefully continue to generate headlines as stats become more accessible. But as noted by Streetsblog readers, raw data accumulated over such an extended period of time can be misleading, and could potentially be used to undercut future efforts to improve safety.
So we ask you: How would you put to use the influx of city- and state-generated crash data? What would your criteria be for employing data to guide tangible street safety measures?
Share your ideas, from the pragmatic to the fantastical, in the comments.


