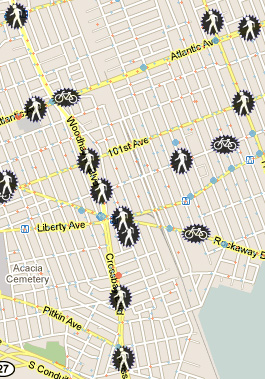
CrashStat, the interactive map of cyclist and pedestrian injuries and fatalities, is one of the most important tools for New Yorkers who want to make their streets safer. Nothing else lets you quickly access the safety stats for your community or visualize the injury rates at specific intersections and streets.
Transportation Alternatives is now looking to deploy a new and improved CrashStat, adding more kinds of data and giving users more flexibility in how they access it. Currently, you can see safety stats at the borough, community district, or intersection level. The upgrade will add legislative districts, police precincts, and neighborhoods, and users will also be able to see data within boundaries they draw themselves.
The new CrashStat will also make accessible additional information about each crash on the map. T.A. already has access to information like the age and sex of the victim, the collision type, and the contributing factors to the crash, and the new platform would put that data online.
"CrashStat 3.0 would allow you, for example, to look at speed-related crashes in a specific state assembly district," said T.A. IT director Mike Infranco. That could allow local residents to petition their representative to support speed cameras. If most pedestrian injuries in a particular neighborhood were caused by motorists failing to yield at an intersection, said Infranco, that could inspire a community group to request leading pedestrian intervals.
Separate from the upgrade, T.A. is currently adding 2006-2008 data to CrashStat. CrashStat 3.0 would integrate 2009 and possibly 2010 crash data. T.A. also wants the new CrashStat to be embeddable onto other websites.
T.A. is currently asking for proposals from developers to build the new CrashStat. The deadline to submit a bid is February 28.


