Department of Health Takes a Snapshot of Bed-Stuy Cyclists
 Image: NYC Department of Health
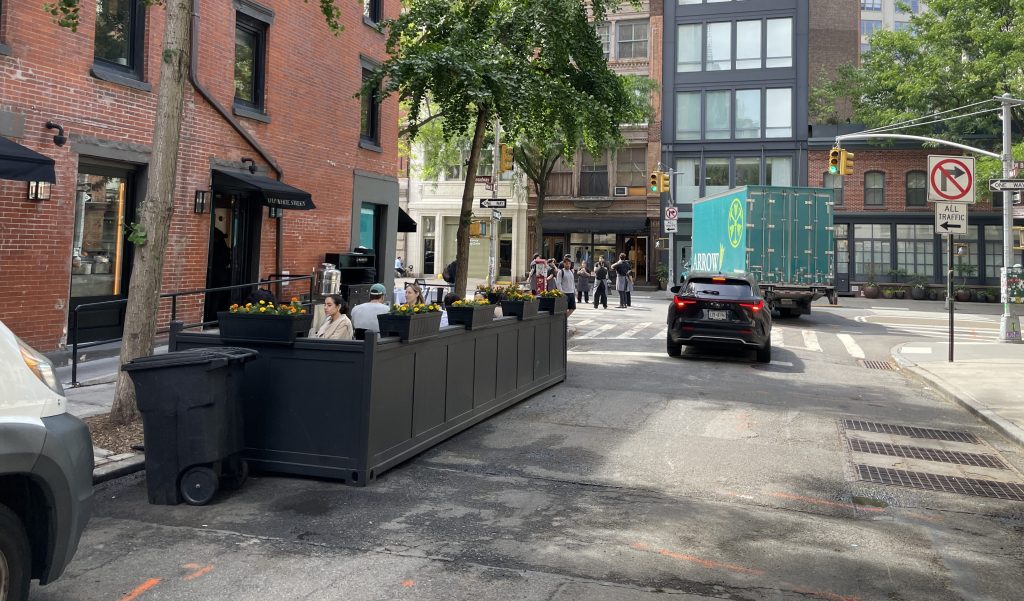
The city’s Department of Health has made encouraging physical activity, which can help prevent obesity, diabetes, heart disease, and other ailments, a top priority. As part of promoting healthy lifestyles, the Department’s Brooklyn District Public Health Office spent last summer studying cyclist behavior in Bedford-Stuyvesant to learn who in that neighborhood travels by bike, and how, so as to better be able to promote cycling in the broader North and Central Brooklyn area. The recently released results [PDF] provide a rare neighborhood-scale look at who cycles, how they ride, and what they think of biking conditions.
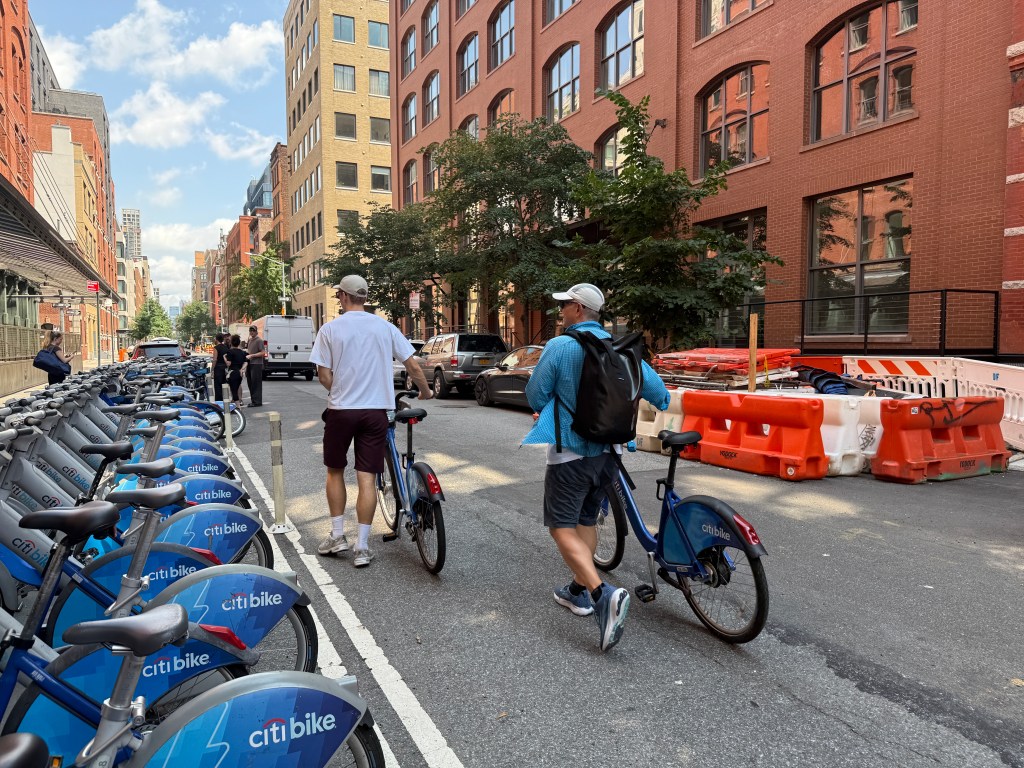
DOH studied cyclists on four blocks with bike lanes. Two, DeKalb Avenue where it crosses Throop and Bedford Avenue where it crosses Fulton Street, had buffered lanes. The others, Tompkins at Putnam and Franklin at Myrtle, had unbuffered painted lanes. The researchers gathered most of their data on cyclist behavior using video cameras, and also conducted more than 300 surveys.
 Image: NYC Department of Health
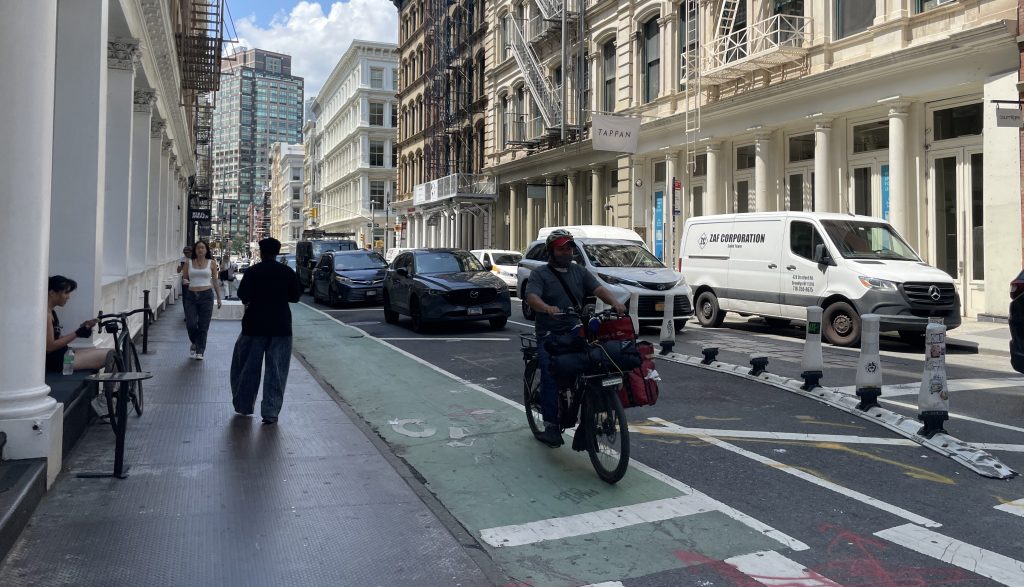
During the 10 recorded hours at each intersection, spread across the week, over 2,400 cyclists rode through the study areas: more than one per minute at each crossing. Most cyclists — 89 percent — rode in the bike lane, and those riders were obstructed by an illegally parked or idling car fully 10 percent of the time captured on camera.
Demographically, 80 percent of the cyclists were men, with 40 percent identifying as
black, 39 percent as white, 15 percent as Hispanic, and two percent as
Asian. They tended to be regular commuters, with 65 percent reporting biking for half an hour or more at least five days in the previous week, and most lived in the area.
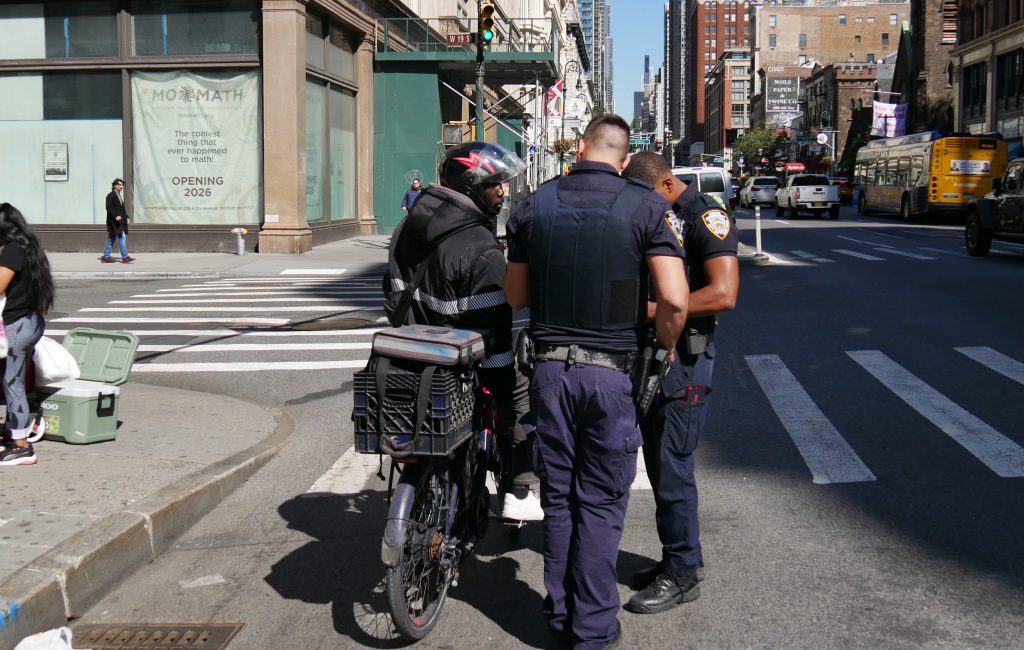
The survey also underscored the need for further bike safety improvements across the city. Of the cyclists surveyed, 27 percent had been involved in a crash in the last three years alone and a full 74 percent had felt unsafe on their bike.
One reason that DOH survey is particularly important is the lack of decent data about biking behavior outside Manhattan. DOT’s screenline count tracks only the crossings into the Manhattan CBD while a Department of City Planning study from last year looked at Manhattan bike lanes between 2001 and 2008. Census data covers the entire city, but is believed to undercount cycling by ignoring non-commute trips. These Bed-Stuy numbers may only be a one-year snapshot of a single neighborhood, but it’s all part of painting a fuller picture of New York City cyclists.

Read More:
Streetsblog has migrated to a new comment system. New commenters can register directly in the comments section of any article. Returning commenters: your previous comments and display name have been preserved, but you'll need to reclaim your account by clicking "Forgot your password?" on the sign-in form, entering your email, and following the verification link to set a new password — this is required because passwords could not be carried over during the migration. For questions, contact tips@streetsblog.org.