The ‘Burbs: Extremely Safe or Especially Dangerous?
Long Island is safe. So safe that police recruits are flocking to the island’s two counties, according to an article in last Tuesday’s New York Times:
High pay coupled with low crime rates make a coveted Long Island job “like winning the lottery in law enforcement,” said Eugene O’Donnell, a professor of law and police studies at John Jay College. Nassau [County] has the lowest crime rate in the nation of any place with more than one million people, and Suffolk is not far behind.
Long Island is dangerous. So dangerous that “After a deadly day on Long Island roads,” Newsday reported last Wednesday:
Sen. Charles Schumer is calling for a safety audit of roadways in Nassau and Suffolk, which have more fatal accidents than any other county in the state.
A decade ago, Northwest Environment Watch (now the Sightline Institute) published a memorable report showing that violent deaths were less common in Seattle than in the surrounding suburbs. The author of this myth-buster, Alan Durning, took the novel but logical step of combining traffic fatalities with homicides and found fewer violent deaths (per million people) in the central city. It wasn’t that city drivers were saner. Rather, city dwellers spent less time driving than suburbanites, giving them fewer opportunities to kill themselves or other Seattle residents on the roads, which more than offset the city’s higher homicide rate.
A similar calculation for New York City and Long Island, using 2005 data, likewise upends the conventional wisdom. Per million people, Long Island had 51 fewer homicides (16 vs. 67), but 50 more traffic fatalities (89 vs. 39), than New York City. In terms of total violent deaths, the difference between the Big Apple and Long Island – 105 deaths per million people in the City, 104 on the Island – is statistical noise.
What this means for our police, I’m not exactly sure. But perhaps it can lay to rest, once and for all, the myth that violent deaths stop at the city line. Indeed, if recent trends continue, the risk-averse may start pulling up stakes from Lindenhurst and hunting for a house in Lefferts Gardens.
|
Combined homicides + traffic fatalities per million, 2005
| |
|---|---|
| Richmond (S.I.) | 74 |
| New York (Manhattan) | 86 |
| Nassau | 87 |
| Queens | 94 |
| Suffolk | 120 |
| Kings (Brooklyn) | 123 |
| Bronx | 127 |
Download the spreadsheet Komanoff created to derive this data.
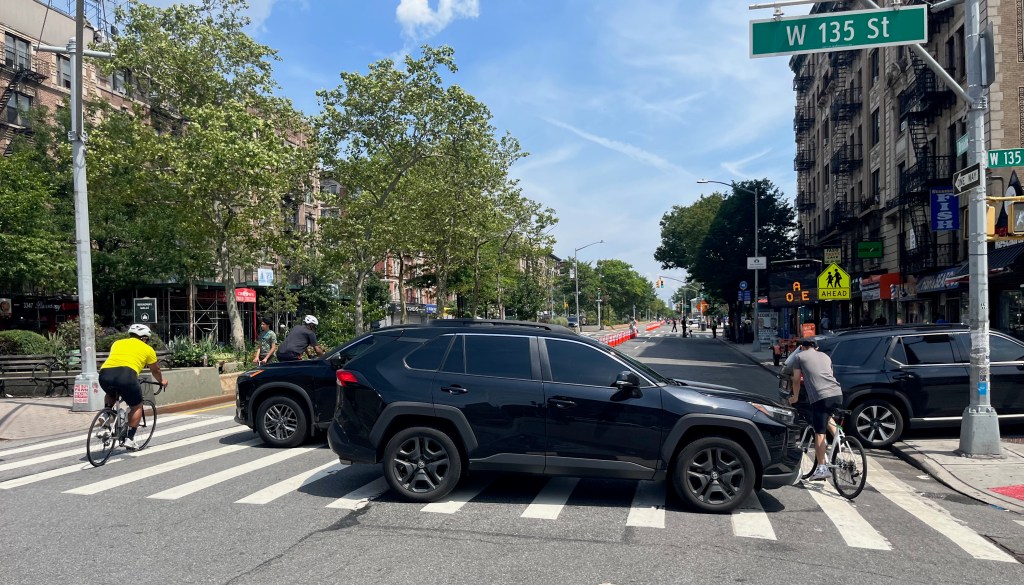
Photo: klauskinski/Flickr

Read More:
Streetsblog has migrated to a new comment system. New commenters can register directly in the comments section of any article. Returning commenters: your previous comments and display name have been preserved, but you'll need to reclaim your account by clicking "Forgot your password?" on the sign-in form, entering your email, and following the verification link to set a new password — this is required because passwords could not be carried over during the migration. For questions, contact tips@streetsblog.org.