KOMANOFF: Here’s How We’ll Know That Congestion Pricing Is Working
Barring a last-minute hitch, congestion pricing is set to roll at 12:01 a.m. on Sunday, Jan. 5, with promises to fund $15 billion in transit improvements, and also the hope of unsnarling unsnarl traffic in Manhattan’s central business district. Here’s how we’ll know whether it’s delivering:
Toll revenue
The MTA has been tight-lipped with congestion pricing revenue projections.
As everyone knows, the 2019 authorizing legislation requires that congestion pricing bring in enough revenue to bond $15 billion of MTA capital investment. Standard financial algebra suggests that such a mandate requires a reliable revenue stream of around $1 billion a year, yet the MTA never divulged precisely how much revenue it anticipated from the Traffic Mobility Review Board’s November 2023 toll recommendations (which the MTA board adopted in March).
Credulous journalists assumed the TMRB $15 toll would only net the requisite $1 billion, or perhaps a tad more. The MTA was content to let that belief stand … until Hochul’s congestion pricing resuscitation last month with a $9 peak toll. That’s when the Authority told reporters that the take will be merely $500 million a year. (See here and here and here and here.)
That’s nonsense. My BTA model (downloadable 20 MB Excel file) calculates that the toll on cars and trucks entering the congestion zone will generate around $970 million a year. More money will come via the new surcharges on taxi trips ($35 million) and ride-hail trips ($130 million) that touch the zone. The total, $165 million, coincidentally matches my estimate of the annualized cost to build and operate the toll collection system along with the various economic and environmental mitigations. This will put the net revenue gain at $970 million, more or less.
Let’s translate those annual revenue figures to a daily basis:
- Cordon toll, weekdays: $2,950,000
- Cordon toll, weekends/holidays: $2,000,000
- Yellow cabs, weekdays: $84,000
- Yellow cabs, weekends/holidays: $74,000
- Ride-hails, weekdays: $355,000
- Ride-hails, weekends/holidays: $390,000
These projections can benchmark actual congestion pricing revenues, but only if the MTA releases its cordon toll revenue tallies, which it should do at least weekly, though daily would be best. For-hire vehicle surcharge revenues should be posted weekly or daily by either the MTA or the NYC Taxi & Limousine Commission, or both.
The revenue figures will be watched closely. The number of uncharged vehicles should receive extra scrutiny
Travel speeds
Foes of congestion pricing repeatedly decry the lack of an explicit congestion-reduction goal in the 2019 enabling legislation. They have a point. The MTA’s sprawling 2022 Environmental Assessment graded its toll scenarios based on reduced vehicle entries or vehicle miles traveled, not on increased travel speeds.
Yet drivers’ time savings constitute the biggest expected benefit from congestion pricing, by far. This is especially true at the outset, before the transit improvements funded by congestion pricing have materialized and there are no time savings yet for subway users. Moreover, speedier driving and trucking has been promised to those who will be paying the tolls. It behooves us, then, to put increased vehicle speeds front and center in our assessments of the program.
Fortunately, comparing before-and-after vehicle speeds should be a snap, thanks to a superb dataset from the city Taxi & Limousine Commission’s Taxicab Passenger Enhancement Program (TPEP). Since 2015, the TLC has required yellow and green taxis to be equipped with devices that record each fare trip’s pick-up and drop-off times and locations. Each month, city DOT’s analytics unit distills the millions of trip records into mile-per-hour averages for the congestion zone, as in its most-recent array late last month:
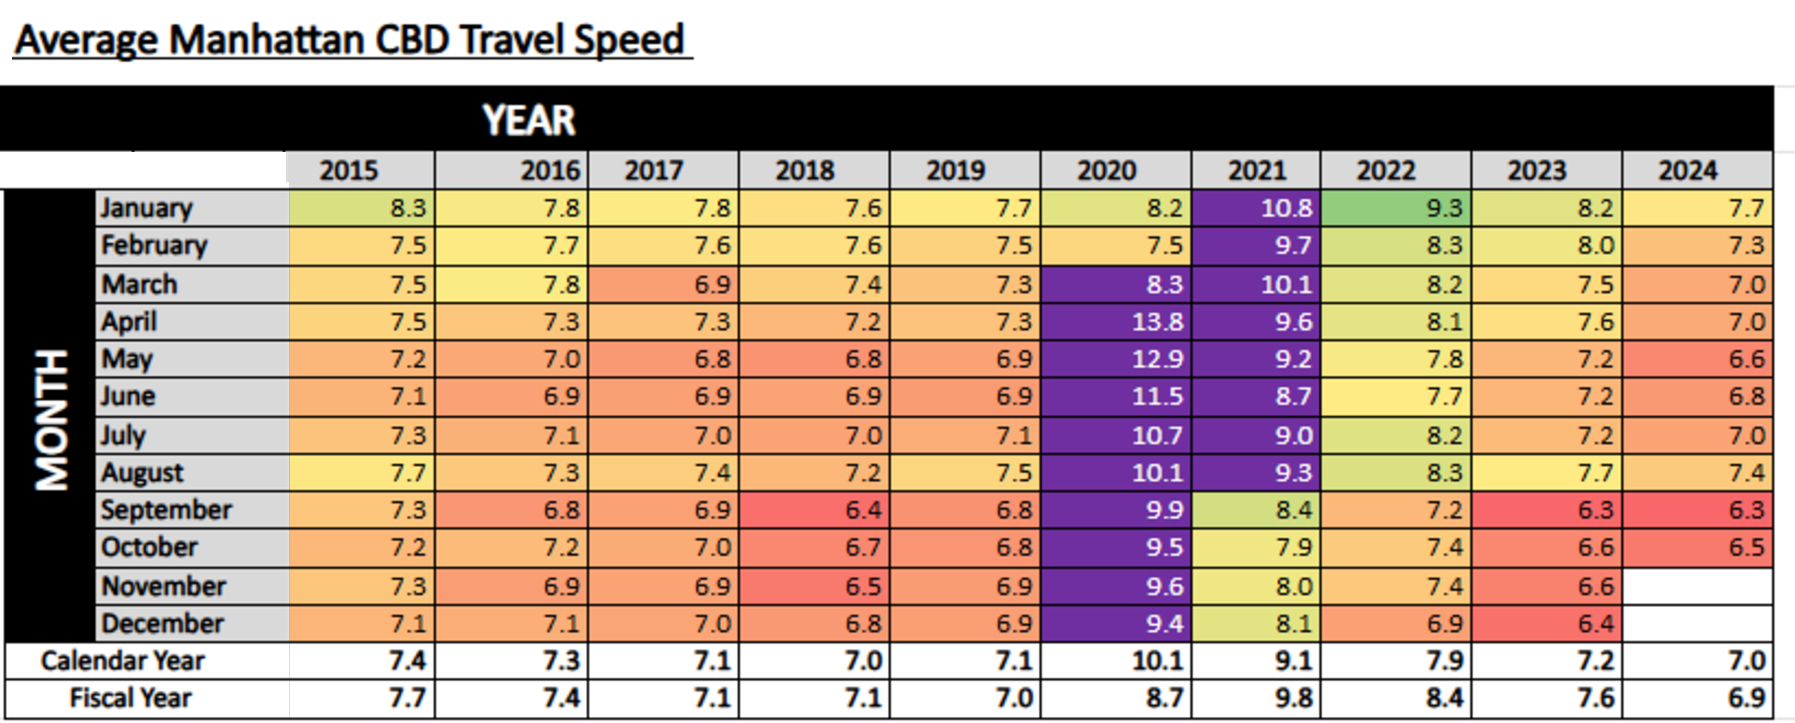
To be sure, a monthly compilation may not be fine enough for New York’s ready-to-pounce media lords, whose vision is obscured by a thick windshield of car culture. At least during congestion pricing’s startup months, the city Department of Transportation should provide weekly and even daily before-and-after averages, along with access to the underlying datasets.
But for now, please curb your enthusiasm and don’t expect dramatic gains in congestion-zone vehicle speeds right away. My modeling finds that the $9 peak toll will bring about only a 5 to 6 percent gain in average speeds inside the zone, and half as much outside. Yes, before long the 5- to 6-percent gain will reach 12 percent as the transit improvements kick in. Moreover, the peak toll ramp-up to $12 in 2028 and $15 in 2031 will push those figures even higher, to an ultimate 15.7 percent average speed gain in the zone and 8 to 9 percent outside, according to my modeling.
What does this mean to a driver traveling, say, 4.4 miles on a direct route from Rockefeller Center to Hanover Square? At the current 7 miles per hour average speed within the congestion zone, a 5.5-percent boost in speed trims two minutes off the trip, and of course twice that for a round-trip. Consider further that minutes and hours saved outside the zone will be twice the savings inside, owing to the far greater number of miles traveled that will be shaved from the regional total as the toll winnows trips into the city’s core from all over. Again, the above gains are only from congestion pricing’s first installment.
Transit ridership
Don’t look for a big instant rise in subway and bus use. Motorists’ tendency to switch to transit as driving into the congestion zone is made costlier (“cross-elasticity” in economists’ parlance) is low. My modeling predicts only an immediate uptick of 24,000 weekday subway rides, a gain of about six-tenths of one percent over the 4 million daily baseline.
New York City Transit bus weekday ridership will increase by 13,000 per day, a gain of 0.7 percent. The projected percentage rise in bus use is greater than for subways because of improved vehicle travel speeds.
These initially low percentages will rise considerably over time, as the subway improvements financed by the congestion revenues take root. Even ignoring the phased-in rise in the congestion charge to $12 in 2028 and $15 in 2031, i.e., keeping the $9 peak toll constant, my projected 0.6 percent “overnight” bump in weekday subway usage grows to 3.2 percent in 2028 and to 6.0 percent in 2031 as faster subway service attracts drivers and non-drivers alike.
The 0.7-percent immediate rise in bus use will increase as well on account of the thinning of traffic, to 0.9 percent in 2028 and 1.1 percent in 2031.
For-hire vehicles
I also anticipate an immediate 5-percent uptick in taxi (yellow-cab) rides, as the thinning of private car volumes makes taxi use more attractive on account of both faster trips and lower fares due to lesser “wait times” built into taxis’ fare structure.
These benefits will more than offset the additional $0.75 surcharge starting Jan. 5 on taxi trips touching the congestion zone, according to my modeling. Ride-hails will see only a meager rise in volumes, 0.7 percent, as their new $1.50 surcharge cancels out most of the carrot of higher speeds and also transfers a small slice of their FHV market share to traditional taxicabs.

Read More:
Streetsblog has migrated to a new comment system. New commenters can register directly in the comments section of any article. Returning commenters: your previous comments and display name have been preserved, but you'll need to reclaim your account by clicking "Forgot your password?" on the sign-in form, entering your email, and following the verification link to set a new password — this is required because passwords could not be carried over during the migration. For questions, contact tips@streetsblog.org.