The violence on New York City streets is even worse than you thought.
Crashes that cause injuries, total injuries and injuries to pedestrians are up by double-digit percentages so far this year, according to the latest NYPD statistics — grim numbers that echo the larger problem of soaring road fatalities this year.
Breaking down the numbers for Jan. 1 through March 6 presents stark relief about the life-and-death choices New Yorkers make when they simply go outside for a walk or bike ride:
- Injury-causing collisions are up 15.4 percent citywide.
- Total injuries are up 12.1 percent citywide. In the first 65 days of the year, 6,977 people have been injured in crashes, or 107 every single day.
- Pedestrian injuries are up 47.2 percent. On an average day in New York City, 23 pedestrians are injured on the street.
- Injuries to moped riders are up by quadruple digits, from 18 injuries in the first two-plus months of 2021 to 198 this year.
In all cases above, Brooklyn South and the Bronx are being particularly hard hit. In those 25 precincts, 2,728 people have been injured in crashes this year. And 603 of them are pedestrians — or nine walkers per day in just one-third of the city's precincts.
Lest anyone dismiss the findings as a relic of low crash and injury numbers from the early part of 2021 due to lingering pandemic lockdowns, the numbers for February versus the previous month are even more alarming. Comparing the period of Feb. 6 to March 6 against the previous 28 days, one finds:
- Collisions that cause injury are up 19 percent.
- Total injuries are up 13 percent.
- Pedestrian injuries are up 15 percent. In the last 28 days, an average of 22 pedestrians per day were injured.
- Injuries to cyclists are up 24.5 percent. In the last 28 days, an average of seven cyclists were injured every day.
Again, the injuries are centered on Brooklyn South and the Bronx. In those 25 precincts, 1,161 people were injured last month — or an average of 41 people per day.
Advocates were alarmed when Streetsblog shared the findings.
“Each crash is a preventable tragedy that could have been stopped had our city implemented proven measures to keep people safe,” said Elizabeth Adams, Senior Director for Advocacy and Organizing at Transportation Alternatives. “To stop the traffic violence crisis, city leaders must urgently redesign dangerous roads and strengthen the Dangerous Vehicle Accountability Program to get reckless drivers off the roads. This year, Albany must also pass the full Crash Victim Rights and Safety Act and give New York City the freedom to strengthen our life saving automated enforcement programs that save lives across the five boroughs.”
Drilling down, this year's pedestrian injury increase is worse in four precincts: Brooklyn's 75th (East New York), 67th (East Flatbush), 70 (Flatbush/Midwood) and 61st (Sheepshead Bay/Homecrest), and the Bronx's 44th (High Bridge):
- In the 75th, which is mostly represented in the Council by Charles Barron, 52 pedestrians have been injured this year. That's an 85-percent increase over the same period last year, and an 11-percent increase over the previous 28 days.
- In the 67th, which is represented by Council Member Rita Joseph, the 51 pedestrian injuries this year represent a 70-percent increase compared to last year. Total injuries are up 22 percent. This month, pedestrian injuries are up 45 percent.
- In the 70th, which is mostly represented by Joseph, the 47 pedestrian injuries this year represent a 113-percent increase over the same period last year. This month, total injuries are up 124 percent and pedestrian injuries are up 242 percent compared to the month before.
- In the 61st, which is represented by Council Member Inna Vernikov, this year's 47 pedestrian injuries are 113 percent more than the same period last year. Collisions with injuries are up 34.5 percent. Over the last 28 days, pedestrian injuries are up 360 percent, and collisions with injuries are up 72 percent.
- And in the 44th, which is represented by Council Member Althea Stevens and Diana Ayala, the 41 pedestrian injuries represent a 78-percent increase from the same period last year. Total injuries were up 40 percent this month compared to the prior 28 days.
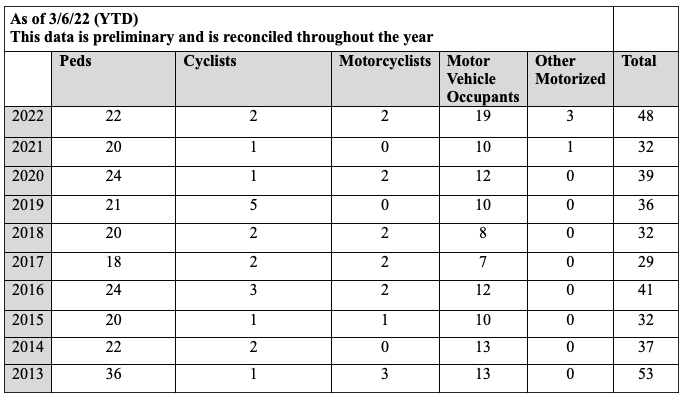
The rise in injuries is coming exactly as road fatalities are increasing, too. Through March 6, the Department of Transportation said that 48 people had died in crashes, up 50 percent from the 32 fatalities during the same period last year.
It's not entirely clear what is driving the increasing carnage on the roadways that drivers are causing, but it is clear that the impact is disproportionately leveled on lower-income communities and communities of color. Joseph's district, for example, is 81 percent Black and Latino. Barron's district is 92 percent Black and Latino. The combined Ayala and Stevens districts are 90 percent Black and Latino.
Barron has become a recent Evangelist for street safety after telling Streetsblog last year during his campaign for Council as saying, "I know that bike lanes are important, if only because it will cut down on pollution, but honesty compels me to say that’s not a priority in my community.”
"It has been at the top of my agenda since we last spoke," Barron said this week. "The Adams admininstration needs to prioritize safety in the neighborhoods where the stats are going up."
Barron said the increase in road violence is a lingering effect of the Covid-19 pandemic.
"Covid hit the poor communities harder, particular in receiving social services or jobs and I think that is contributing in an indirect way," he said. "We don’t look at poverty and infrastructure together. The mayor needs to prioritize safety."
Joseph has been one of the few Council newcomers to focus on street safety, and was on hand when Mayor Adams held his lone press conference on road violence in January at the corner of Caton and Coney Island avenues. Her district also includes murderstrips such as Flatbush and Church avenues, and Linden Boulevard.
"We know that DOT is taking steps, but time is of the essence," said Joseph's chief of staff, Sam Weinberger. "Each day we delay is a day when more people are injured or potentially killed. This is not a street safety problem, it's a street safety crisis. Every time she sees the mayor or his people, she tries to bring it up."
Vernikov issued the following statement:
Several weeks ago, I attended the heart wrenching funeral of a 15-year-old child who was killed by a bus as she walked to her school one morning. Since then, my district saw the death of a 99-year-old Holocaust survivor, hit by a car as he was riding his electric scooter to synagogue. A 4-year-old child still lies in a hospital bed, three weeks after he was hit by a vehicle in my district. These incidents have been exceptionally jarring for me, and have brought pedestrian safety to the forefront of my agenda as I look ahead to my term in the City Council.
I invited Families for Safe Streets and Riders Alliance to my district last week, and we discussed some of the most dangerous intersections in the district and possible solutions. I will continue to work with them on this. My office also met with DOT at an intersection where a traffic fatality occurred last year, and DOT has drawn up plans to improve the safety at that intersection.
To the credit of Mayor Adams’ administration, his Department of Transportation has responded to a significant pedestrian safety issue outside a school in Sheepshead Bay, and already made necessary repairs. I have submitted multiple requests for traffic studies at danger zones, and I am hopeful that DOT and the Mayor’s office will prioritize these locations for traffic signals before there is a crash or another fatality.
Ayala and Stevens declined to comment.
For its part, the DOT confirmed that injuries are indeed up by double-digit percentages so far this year versus the same period last year, which should be alarming because 2021 ended up becoming the most deadly year on New York City roads since 2013 in the pre-Vision Zero era.
But if there's any good news, it's this: This year's injuries are still well below the pre-pandemic "normal," an excessive figure of bloodshed that New Yorkers seem to accept as the cost of doing business.
In the first two months and five days of 2019, for example, 9,229 were injured on New York City streets, compared to the 6,693 in the DOT database for this year. By that measure, roadways are actually 27 percent safer, the agency said. The DOT has also launched an initiative to improve safety at the city's 1,000-most-dangerous intersections.
“Traffic injuries are down when compared to this point pre-pandemic — but we know we can’t move backward," said agency spokesman Vin Barone. "We’re committed to putting an end to this senseless traffic violence and we’re working on ambitious plans to improve safety for everyone on our streets.”
The agency also noted that the lower 2021 numbers reflect, in part, uncharacteristically reduced pedestrian activity during the pandemic as well as heavy snowfall in early in 2021.
