BEHIND THE NUMBERS: Bike Injuries Are Up in Places with Worst Infrastructure
The Bronx is up and the Battery’s down. New York, New York — it’s a dangerous town!
City planners looking at cyclist injury numbers during the COVID-19 pandemic may comfort themselves that injuries are mostly flat compared to the virus-free months last year, even amid a cycling boom — but a true analysis of injuries between March and September reveal that the carnage is steeply increasing in parts of the city with the worst bike infrastructure and where driving has returned to pre-pandemic levels.
Let’s unpack that:
First, according to the city’s own data, injuries to cyclists increased only slightly from March through September this year, compared to the same period last year. In the COVID-era seven-month period, there were — 3,231 cyclists injured, up 1.2 percent from the 3,269 cyclists who were injured in the comparable seven-month period of 2019.
And that comes during a well-documented boom in cycling.
But…
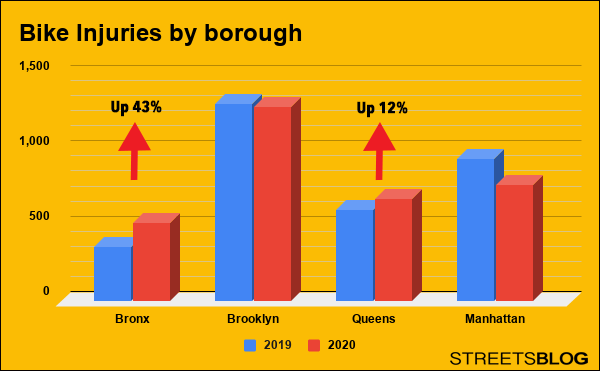
- Injuries in the Bronx — which has the worst bike infrastructure in the city — are up 43 percent in this year’s March to September stretch, compared to the same period last year. In all, 518 cyclists have been injured in the last seven months in the Boogie Down.
- In Queens, which also lacks bike safety infrastructure in the neighborhoods with the highest need, injuries are up 12.2 percent — with 681 cyclists injured in the borough between March and September this year.
- Brooklyn has the highest numbers of injured cyclists because of the sheer number of Kings County residents who cycle. Injuries in the borough are still excessive — 1,294 people were injured in Brooklyn over the last seven months — but they are basically flat compared to last year.
- Even the Brooklyn numbers reveal the danger in neighborhoods with poor bike infrastructure. In the northern half of Brooklyn, where bike infrastructure is substantial, injuries are down 5 percent, but in the southern portion of Brooklyn, where infrastructure is limited, injuries are up 2.2 percent.
- Cyclist injuries in Staten Island (not shown on chart) are up 19 percent during the COVID period, compared to the same months last year — from 53 to 63.
Despite those numbers, cycling injuries appear to be flat citywide, thanks to a steep decrease in injuries to cyclists in Manhattan, which not only has the best bike infrastructure in the city, but also is still enjoying a dramatic decrease in the number of cars filling its streets with danger, congestion and frustration.
Injuries are down 18 percent in Manhattan, comparing March to September of this year against the same period last year — from 948 injuries to 776. That comes as total car miles being driven are still down by almost a quarter versus pre-pandemic numbers, according to Streetlight Data.
At the same time, driving has increased in Brooklyn and the Bronx, and it has basically returned to pre-pandemic levels in Queens, according to the same data.
Taken together, cycling advocates are calling for immediate action:
“For each bike rider who ends up in a police injury report, there are likely several more knocked off their bikes who are able to escape with road rash and bad bruising, but don’t become a statistic,” said Jon Orcutt of Bike New York. “That’s hardly a climate for building bike riding into the resilient and sustainable transportation system New York needs so desperately needs today.”
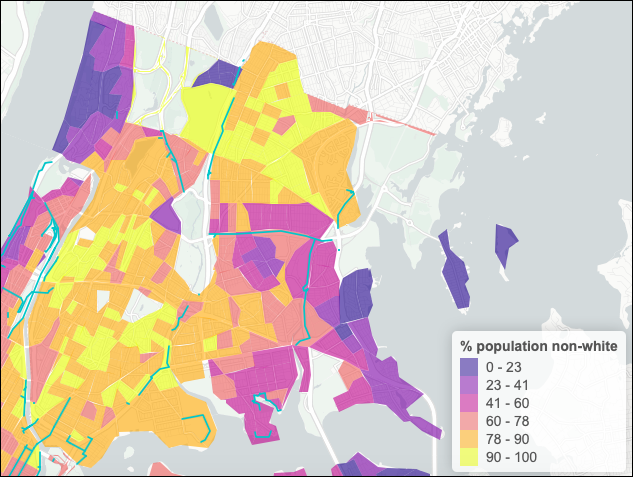
Orcutt specifically blamed the mayor for not creating a more equitable, fuller bike network. The best bike infrastructure still exists in the whitest neighborhoods in the city, as this exclusive data visualization from Streetsblog’s Kira McDonald shows.
“The protected bike lane map is a political map,” Orcutt said. “It’s mostly the fault of the mayor for not saying, ‘We’re doing a good bike network. That’s my policy.’ But [there are also] local officials who make it harder for DOT to allocate space for cycling in many parts of town.”


Read More:

Streetsblog has migrated to a new comment system. New commenters can register directly in the comments section of any article. Returning commenters: your previous comments and display name have been preserved, but you'll need to reclaim your account by clicking "Forgot your password?" on the sign-in form, entering your email, and following the verification link to set a new password — this is required because passwords could not be carried over during the migration. For questions, contact tips@streetsblog.org.