Injuries to cyclists continue to rise in areas that the Department of Transportation specifically dubbed as "safety priority" districts — sometimes by startlingly high numbers, according to data crunched by Streetsblog.
Injuries went up — sometimes by double-digit numbers — in eight priority zones identified in the DOT's 2017 Safer Cycling report as needing special attention because they had the deadly combination of high crash numbers plus insufficient bike infrastructure. Injuries only went down in two of the zones.
Overall, injuries are up 6.5 percent across in the 10 zones.
The report had identified three community boards in eastern Queens (3, 4 and 5) and seven community boards in eastern and southern Brooklyn (3, 4, 5, 12, 14, 15 and 17) to be "Priority Bicycle Districts for bicycle network expansion" because they had 23 percent of incidents where a cyclist was killed or seriously injured yet only had 14 percent of the city's protected and unprotected bike lanes.
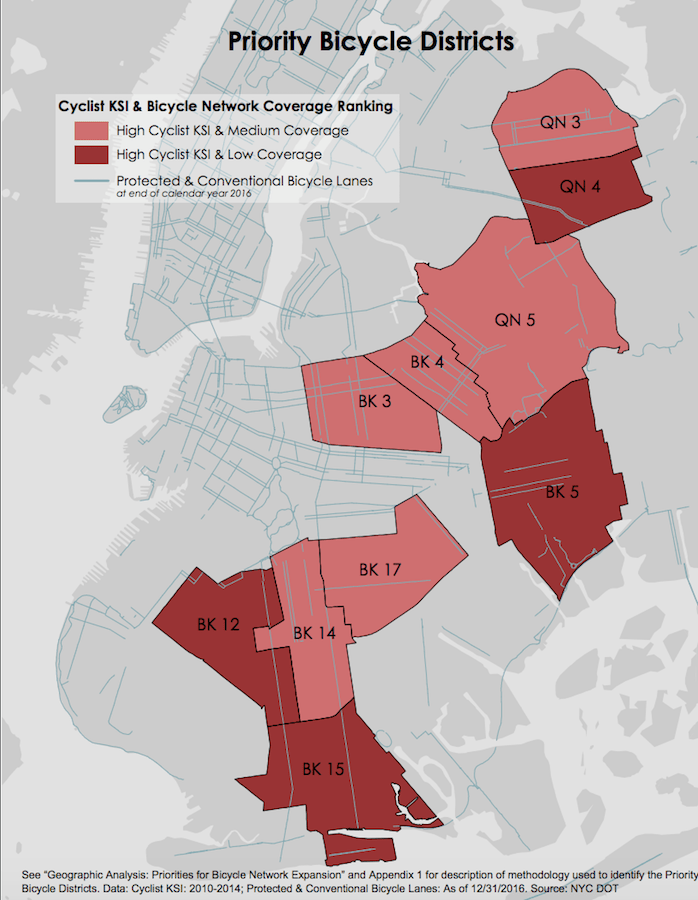
To compare apples to apples, Streetsblog went to the city's own data on Crashmapper and compared data from June, 2014 to December, 2016 — the 31 months before the city designated the priority zones — to the period from January, 2017 to July, 2019, which is also 31 months (though our injury-filled July isn't done yet...).
Overall, injuries in those 10 priority zones are up 6.5 percent. Worse, in the eight zones where injuries went up, they went up a lot: 9.3 percent overall, from 1,936 injuries to 2,116.
The worst increases were in Brooklyn Community Board 12 (24.3 percent more injuries), Brooklyn Community Board 4 (up 23 percent) and Brooklyn Community Board 5 (up 12.4 percent),
In that same time period, injuries decreased in two priority zones — Brooklyn 17 and Queens 4 — falling from 409 cyclists hurt t0 381, a drop of 6.8 percent.
A spokesperson for the DOT said that the agency has installed 14.7 miles of bike lanes in the areas deemed priority zones. In addition, the spokesperson said the agency plans on installing 25 miles of bike lanes the districts this year. However, the agency declined to say what portion of the new and proposed lanes are protected bike lanes, which the agency says are safer than mere painted lanes, which are often seized by drivers for parking.
The distinction between protected and unprotected lanes is a key factor in the discussion of safety, since as the DOT's own presentations show, protected bike lanes have led to a 15-percent drop in injuries to cyclists and a 21 percent drop in injuries to pedestrians.
The DOT also did not respond to a question about why injuries rose in eight of the priority zones.
