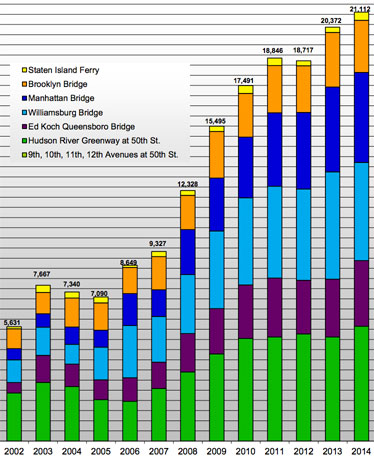
NYC DOT has posted the 2014 screenline bike count [PDF] (after some prodding from us last week), showing a 4 percent increase over the previous year. Following double-digit percentage growth every year from 2006 to 2010, this marks the fourth consecutive year without an increase of 10 percent or more.
The screenline captures bike trips across major thresholds to the Manhattan central business district: The four East River bridges, the Hudson River Greenway at 50th Street, and the Staten Island Ferry Whitehall Terminal. With counts going back to 1985, it's very useful for tracking trends in cycling to and from the city's biggest job centers, but its flaws as a proxy for overall city cycling activity become more apparent every year.
Here's a look at what we can glean from this year's count and what we can't.
Growth in cycling to and from the Manhattan core is slowing
Until 2014, DOT conducted bike counts only once or twice per month (last year the agency started using electronic counters that can continuously collect data), so in any given year the screenline count could deliver a number that's off the mark a bit. But it's now been four years in a row without a double-digit jump. The rate of growth has definitely slowed since 2006-2010, when the annual increases ranged from 13 to 35 percent.
The de Blasio administration has an ambitious bike mode-share target -- 6 percent of all trips by 2020. Imperfect as it may be, the screenline is sending a clear signal that more must be done to make biking feel safe for large numbers of New Yorkers.
Campaigns to improve the approaches to the Manhattan Bridge bike path on Chrystie Street and Jay Street point the way toward reducing key barriers to biking across bridges. The Queens Boulevard protected bike lane NYC DOT is planning to implement later this year should make cycling to the Queensboro Bridge more accessible too, but that brings us to another barrier...
Capacity crunch on the Queensboro Bridge and Brooklyn Bridge
The average 12-hour bike count on the Queensboro Bridge increased a healthy amount to 3,228 -- more than 10 percent higher than its previous peak. But as former DOT policy director Jon Orcutt noted on Streetsblog last fall, the bridge's shared biking and walking path is already feeling uncomfortably cramped. As bike traffic grows on the Queensboro, the case for repurposing the south outer roadway for walking or biking gets stronger.
The average count on the Brooklyn Bridge, meanwhile, dropped from 2,684 to 2,566. The bridge is the quickest route to reach Lower Manhattan and the Hudson River Greenway from Brooklyn by bike, but the narrow promenade is simply inadequate for all the cyclists, walkers, and tourists who want to use it. Don't expect cycling to increase on the Brooklyn Bridge very much until the path is widened or the city dedicates a lane of the roadway to bikes.
NYC DOT needs to do more annual counts in addition to the screenline
Last year was the first time DOT released a screenline count since the launch of Citi Bike. One of the big takeaways was that the screenline count didn't capture the huge increase in cycling in the bike-share zone. This year's count proves that 2013 was no fluke -- the screenline is good at measuring trips across the boundaries of the Manhattan core, but doesn't reflect what's happening inside that boundary. Turning DOT's 2013 bike counts inside the Citi Bike service area into a recurring annual metric could fill this gap in measurement.
The screenline method isn't a good proxy for bicycling activity beyond the neighborhoods that ring the city center, either. Many of the more significant bike projects NYC DOT is developing right now -- like protected bike lanes for Upper Manhattan, Bruckner Boulevard in the Bronx, and 111th Street in Queens -- are too far away from the screenline to register much in the count.
Last September, Transportation Commissioner Polly Trottenberg said DOT had to develop a better method to track citywide cycling. To measure the impact of DOT's upcoming slate of bike projects farther out from the city center, the agency will have to start counting soon.
Correction: This post originally said DOT only counted cyclists one day per month in 2014. In fact, last year the agency began using automated counters, providing a much more robust data-set than in the past -- between 11 and 17 days per month.


