A couple of weeks ago, the New York City Department of Transportation released an epic report summarizing its work since 2007. It's full of statistics, graphics, and recommendations for the future. We picked out a few of the best maps, charts, and graphs from the 212-page document, which show the state of New York City's streets today and offer a glimpse into their future.
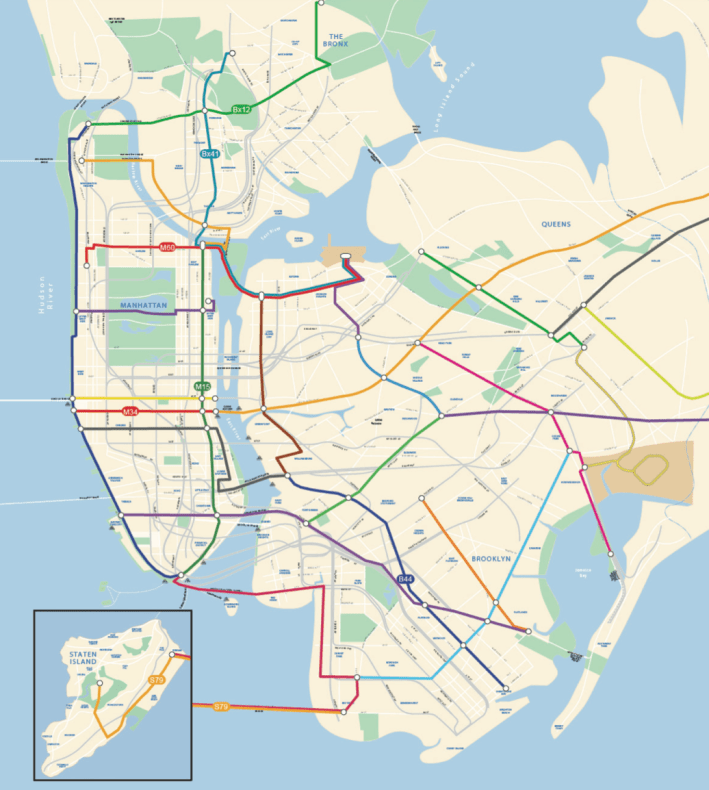
The 2025 Bus Rapid Transit Map: DOT has installed six Select Bus Service routes in six years, bringing camera-enforced bus lanes, pay-before-you-board fare collection, and bus priority at traffic signals to busy routes in four boroughs. If Mayor-elect Bill de Blasio is going to meet his promise to install at least 20 bus rapid transit lines, his next DOT commissioner will have to pick up the pace.
There have been a couple of different maps showing potential enhanced bus routes in the past few years. Advocates at the Pratt Center mapped their priorities for busways in 2008. Earlier this year, the MTA and DOT released a map showing future phases of SBS routes. DOT's latest map shows a potential BRT system in the year 2025 with 17 new routes crisscrossing the five boroughs, filling the gaps in the subway network.
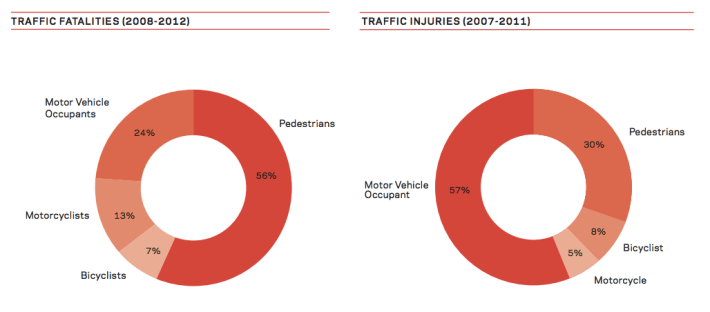
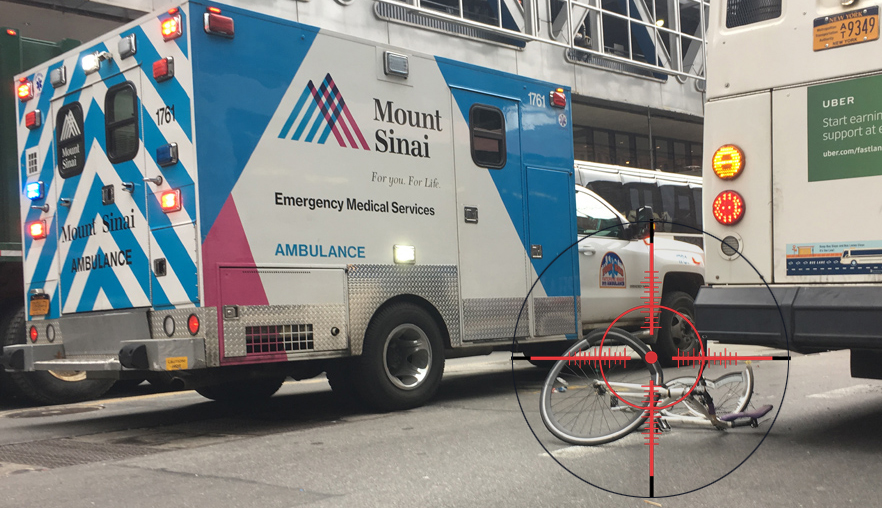
The Most Vulnerable People on the Street: Last year, 274 people died in New York City traffic crashes -- lower than most other years but an increase from 2011. Although motor vehicle drivers and passengers make up more than half of all NYC traffic injuries, it's the people without protective metal around them who are most vulnerable. Three of every five people killed in NYC traffic were walking or bicycling. The leading cause of traffic deaths? Speeding drivers.
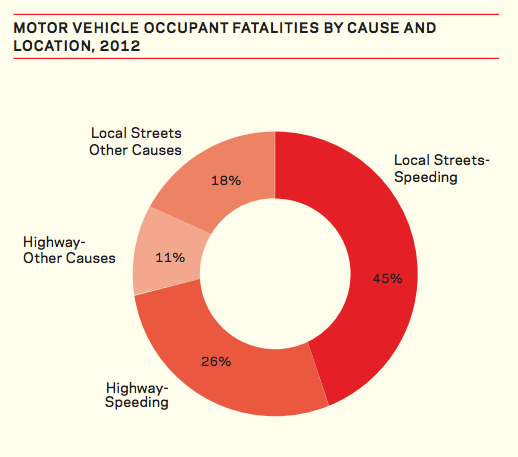
Speeding Kills Motorists: Speeding drivers aren't just a big hazard to cyclists and pedestrians, they also endanger themselves, their passengers, and people in other cars. Seven in ten motor vehicle occupant deaths last year were caused by speeding. Yet AAA New York still insists that automated speed enforcement is only "a revenue enhancement opportunity."
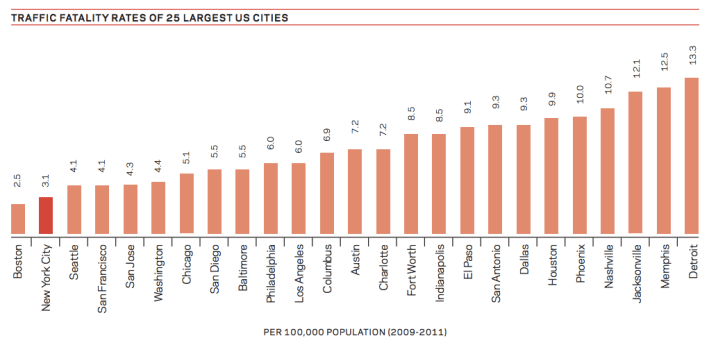
Transit Cities Have Safer Streets: Among the nation's 25 largest cities, New York has the second-lowest traffic fatality rate. The only American city that has safer streets? Boston. By and large, it's cities with better transit systems -- and less car dependence -- that have the better street safety records. Globally, similar large cities show that NYC still has a lot of room to improve. London, Berlin, Paris, Tokyo, and Hong Kong all have lower traffic death rates than the Big Apple [PDF].
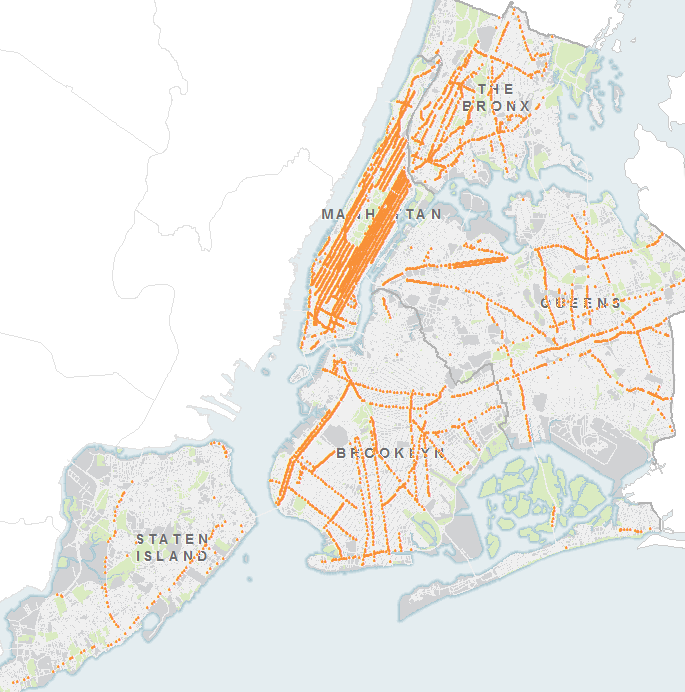
Where the Countdown Clocks Are: DOT says the addition of countdown clocks has cut pedestrian injuries by five percent at the street crossings where they've been installed. Since it started putting them up in 2006, DOT has added timers at more than 2,000 intersections, focused primarily on high-crash areas, and aims to have 8,000 of the city's 12,460 signalized intersections covered by 2016. That still puts NYC behind Washington, DC, which leads the nation with countdown clocks at 95 percent of its signalized intersections.
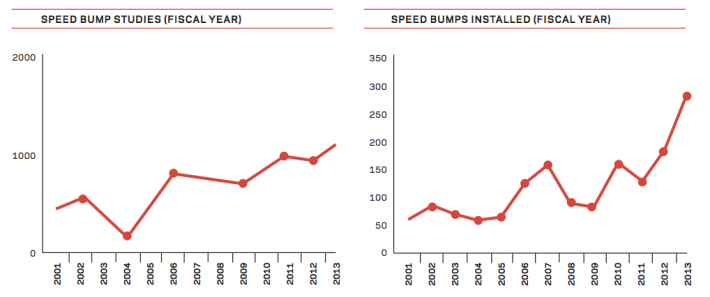
Don't Slow Down on Speed Humps: Countdown clocks are nice, but changing the road itself to slow down speeding drivers is more effective. DOT says speed humps, which are a major component of its popular Slow Zone program, reduce driver speeds by 19 percent and pedestrian crashes by 40 percent. Speed humps are also popular with City Council members, especially around schools: A bill passed last week requires DOT to install at least 50 speed humps near schools annually. The agency has added more than 250 speed humps citywide so far this year, a significant increase from previous years.
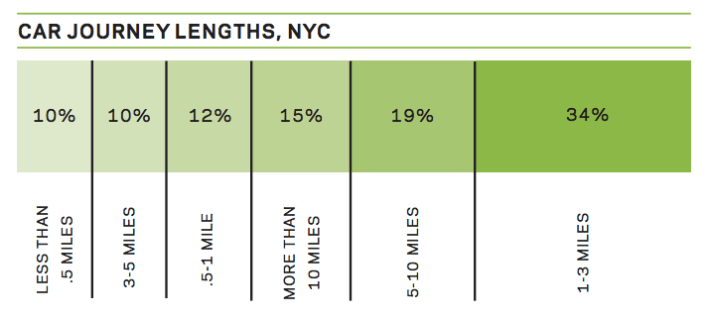
Most NYC Car Trips Are Walkable or Bikeable Distances: New York City is big, but most car trips in the city are surprisingly short: 56 percent are under three miles and 22 percent are under one mile. These are ideal distances for walking or bicycling. By making it safer and easier to get around by foot or bike -- and transit for those longer journeys -- we can improve health, cut traffic, and reduce pollution.
