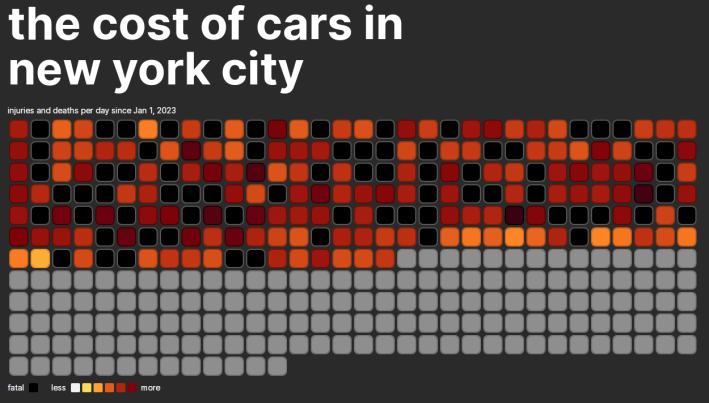
A simple new website is tracking the daily carnage on New York City streets and accompanying financial costs amid an unprecedented rise in cyclist fatalities.
The Cost Of Cars, the brainchild of web Liam Martens, plots out the number of people injured or killed by drivers daily in New York City this year, with each day represented by a colored square from white to dark red.
Darker colored squares represent higher numbers of injuries in a day and a black square represents a day someone was killed in a car crash.
Although city crash statistics show that pedestrian and cyclist injuries are beginning to level off or drop compared to 2022, motor vehicle occupant injuries are still on the rise — and cyclist fatalities have hit a disturbing pace with 20 dead cyclists already this year. Even with fewer injuries this year so far than in 2018 or 2019, there are hundreds of people being injured by cars every week.

While "The Cost of Cars" isn't the first effort to track road carnage, Martens said he wanted to provide a more digestible way for people to understand the bleak situation on city streets.
"I believe this is better at conveying the bleakness of the current situation in the street with the grid being so darkly colored and black squares being so close to each other," the developer said over email.
The site visualizes the frequency of car-related deaths in the city. The data, which has been collected through July 29, shows that at least one person was killed in a motor vehicle-related crash every week in 2023. On six different occasions, at least one person was killed three days in a row, and in three different instances the black squares make a column four squares high, indicating a traffic death on almost the same day each month over four months.
In addition to listing the number of deaths or injuries caused by cars each day, Martens's tool makes the "cost" of traffic violence literal — by attaching a price-tag for things like medical care, infrastructure damage, and lost productivity to each day's crashes as calculated by a 2019 report by the National Highway Traffic Safety Administration.
Crashes in New York City this year cost the various parties involved at least $55,000 per day, according to Martens's calculations — bringing to total cost of injury-causing crashes to close to $200 million through seven months of 2023.
"Condensing these statistics down to a factual 'cost' is more impactful than throwing around a huge report. Being able to say 'So far this year, we have lost $189 million due to collisions and accidents,' feels more impactful and gets people talking," said Martens.
With 25,793 injuries caused by motor vehicles so far this year, that the city is on pace for 44,831 people to be hurt in those crashes in 2023, Martens found. That means that one out of every 176 people you come across has been injured in a New York City crash this year.
"I believe putting numbers into context is important," Martens explained.
"For most people it is natural to put monetary values into context because it is easy to compare to your own life. You can compare it to your salary, rent, mortgage, but the number of injuries feels very difficult to put into context."


