Remember that much-ballyhooed crackdown on drivers who fail to yield to pedestrians — the one Streetsblog debunked last month? Well, it's even more debunkable.
In March, NYPD officers wrote just 1.77 failure-to-yield tickets per precinct per day — down from the paltry 1.81 tickets per day that cops wrote in February, the first full month of the mayor's supposed enforcement push. That's 2 percent fewer tickets despite a publicized announcement that the NYPD would in fact do more.
The overall numbers for March are just as flat: Total citywide moving violation summonses written by cops to dangerous drivers in March amounted to just 22 such tickets per precinct per day, up only slightly from the 21 tickets per precinct per day in February. Compare those numbers to March 2014, at the start of the Vision Zero initiative, when cops wrote 41 moving violation tickets per precinct per day, roughly 86 percent more.
Drilling down to specific important metrics for March 2022:
- Cops wrote just 4.76 speeding tickets per precinct per day, up ever so slightly from 4.7 such tickets per precinct per day in February.
- Cops wrote just 5.08 tickets per precinct per day for drivers running a red light or a stop sight, up ever so slightly from the 4.80 tickets per precinct per day they wrote in February. Compare that to March 2014, when cops wrote 5.67 such tickets per precinct per day.
- Tickets for parking in a bus or a bike lane rose in March to one ticket per precinct every three days from one ticket per precinct every four days in February.
The lack of enforcement may play a role in the increase in crashes. So far this year, according to the NYPD, total crashes are up 1 percent compared to the same period last year; collisions with injuries are up 12 percent; and pedestrian injuries are up 36 percent.
In raw numbers:
- there have been 29,876 reported crashes so far this year or 262 crashes every day on average.
- there have been 10,104 crashes with injuries so far the year, or 88 crashes with injuries every day on average.
- there have been 2,570 pedestrians injured in this city this year, or 22 injured pedestrians every day on average.
Looking at individual precincts shows a lack of focus on local concerns:
- The 75th Precinct in Canarsie, Brooklyn, has had the most crashes so far this year (1,143, or 10 per day). Yet in March, its officers wrote no tickets for parking in a bus or bike lane; just 35 tickets for speeding (down from 66 in February, despite three fewer days) and just 83 for failure to yield (up slightly from the 65 tickets written in the 28-day previous month). Perhaps such numbers explain why the 75th has had the most pedestrian injuries so far this year.
- The 105th Precinct in eastern Queens has also had about 10 crashes per day so far this year. Yet in March, its officers also wrote no tickets for parking in a bus or bike lane; 143 tickets for speeding (down from 151 in the shorter month of February) and just 35 tickets for failing to yield (up only slightly from the 25 in February).
- The 61st Precinct in southern Brooklyn has had the second-most pedestrian injuries so far this year (73 total or roughly one injured pedestrian every other day). Yet in March, its officers wrote just 80 failure-to-yield tickets, or 2.6 per day, down dramatically from the 98, or 3.5 per day, they wrote in February. Total moving violations in that precinct rose sightly to 435 in March from 412 in February, but that's actually a per-day decline to 14.0 in March from 14.7 per day in February.
- The bike-centric 90th Precinct in Williamsburg has had the most cyclist injuries so far this year (34 total). Yet in March, its officers wrote only 66 failure-to-yield tickets (down from 71 in the 28-day month of February), and 47 tickets for speeding (down from 70 tickets in the shorter prior month). Overall, officers in that command wrote just 20.8 moving violation tickets per day in March, down from 21.2 in February.
In other words, there's not much of a crackdown occurring right now against reckless driving or dangerous parking.
Seriously, @NYC_DOT, in what way is this Vernon Boulevard bike lane "protected"? This happens every weekday, and the @NYPD114Pct could not be less helpful. #bikenyc #bikeqns @NYCBikeLanes @CabanD22 @NYCMayor @NYCMayorsOffice pic.twitter.com/Zmu3gFWYne
— BronxBikeGuy (@BikeBronx) April 26, 2022
Meanwhile, yesterday, police decided to crack down on cyclists on Second Avenue in Manhattan:
#bikenyc sting by @NYPDnews on 2nd Ave at 67th
— DaaaaveTV (@DavidEM47) April 27, 2022
But it has been that way for a while. Consider that in 2014 — the first year of then-Mayor de Blasio's Vision Zero initiative, cops wrote 1,062,504 summonses for moving violations against drivers. By 2021, the last year of the same initiative under the same mayor, they wrote just 508,284 — a drop of 52 percent.
And failure-to-yield tickets dropped from 36,942 in 2014 to 29,121 citywide last year — a drop of 21 percent.
Advocates have long said that the police department is not the best tool for reining in reckless drivers, preferring a combination of road redesigns and automated enforcement. But it's useful to examine what the NYPD is doing in the context of a mayor who continues to promote the agency as a key means of reducing the road violence death crisis that has continued into his administration.
“This is why we need to implement failure-to-yield cameras like they have in Washington, D.C. [and] keep redesigning streets because we can’t rely on NYPD to take enforcement seriously," StreetsPAC Executive Director Eric McClure told Streetsblog last month. "If we’re going from one failure-to-yield ticket to two, it’s meaningless.”
Meanwhile, Commissioner Keechant Sewell has consistently used her Twitter account to maintain focus on a different kind of violence:
The work of NYPD Neighborhood Safety Teams is underway and the results are clear — guns being taken out of NYC neighborhoods. In @NYPDPSA7, officers arrested the individual carrying this ghost gun at the Gouverneur Morris Houses in #TheBronx.
— Commissioner Sewell (@NYPDPC) April 22, 2022
Grateful for their dedication. pic.twitter.com/Fqt69bkJ6f
In fact, since being sworn in on Jan. 2, Sewell has tweeted 21 times about guns or shootings and zero times about road violence, traffic safety or enforcement of moving violations. Even on Jan. 19, when she joined Mayor Adams at the launch of her agency's promised crackdown on reckless drivers, she did not post anything about the event on her Twitter account.
Interestingly, there have been 29,876 reported crashes so far this year, injuring 13,503 people on the roads. By comparison, there have been 376 shootings so far this year, injuring 441 people. Expressed graphically:
Pressed for a comment, the NYPD sent over the following statement from a spokesperson who did not provide his or her name:
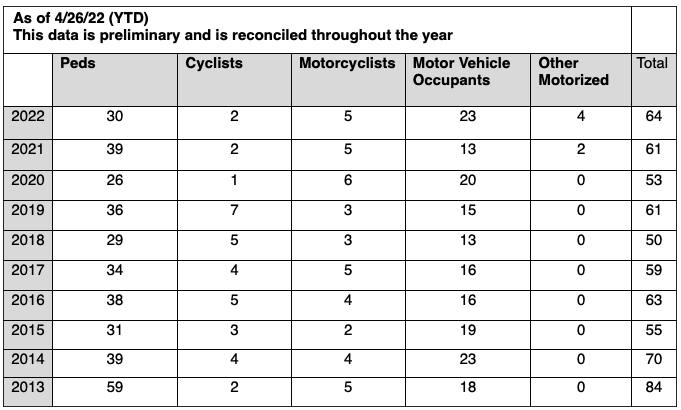
Decreasing traffic fatalities are at the core of the NYPD’s traffic safety initiatives. This year, we have an experienced an increase in overall traffic fatalities and vehicle occupants have been driving the increase in the number of deaths. It should be noted that as of April 26 the month of April 2022 has shown a 75-percent reduction in overall traffic deaths when compared to the first 26 days of April 2021. [DOT provided a broader picture of fatalities so far this year, which are up]:

Traffic deaths are most prevalent on our Northern Manhattan and Bronx highways, mostly during the overnight hours. To address this unacceptable trend and reckless driving behavior, the NYPD’s Highway Unit has stepped up enforcement on highways where the data has shown a rise in injury and fatal collisions.
On local streets, 51 percent of pedestrian deaths occur at intersections, which is caused by drivers failing to yield to pedestrians as well as not slowing down. Pedestrian deaths in 2022, as of 4/26/22, decreased 23 percent as compared to the same period in 2021.
When looking beyond the month of March and reviewing the 28-day period of March 28 to April 24, hazardous violations have increased 44 percent overall. This includes an 88 percent increase in speeding summonses issued. [Streetsblog could not fact-check this, as April's full numbers have not been released and the NYPD does not release weekly numbers.]
Precision enforcement is taken against drivers that fail to yield to pedestrians and cyclists at intersections. This year, the hazardous violation enforcement in this area has increased 33 percent to 13,354 from 9,998. We have also continued to conducted Vision Zero High Visibility Corridor Enforcement and Education operations, which strategically deploys personnel to conduct traffic enforcement and education in precincts where it is needed most; at locations where the data has shown a high number of vulnerable road users injured in traffic collisions. This layered enforcement strategy is a collaboration with our Vision Zero partners to drive down fatalities as well as to protect pedestrians and bicyclist [sic].


