OPINION: The Congestion Pricing Toll Really Should Be $80
This toll should really take a toll.

Most discussions of the pending New York City congestion pricing program assume that auto tolls will be in the $13 to $15 (round-trip) range, with a lesser toll, perhaps as low as $4 or $5, for off-peak trips. That’s according to Streetsblog contributor Charles Komanoff, who has been researching and modeling congestion tolling since the early part of this century, and believes a $13 toll would be the bare minimum for the state to reach its legislatively mandated $1 billion annual revenue requirement.
That $13 coincides with tolls currently charged by the Metropolitan Transportation Authority on its six major bridges and tunnels. And, because the $13-$15 range has dominated congestion pricing discourse for years, it has created its own sense of political inevitability. Considerably higher car tolls are easily dismissed as politically infeasible.
A $13 or $15 congestion toll might be all the politicians think they can achieve, but such a low fee will fail to maximize the net societal benefit conferred by congestion pricing. In fact, the toll needs to be much, much higher.
I determined this using Komanoff’s Balanced Transportation Analyzer modeling tool.
As Streetsblog readers know, the BTA is an open and freely available model for analyzing how different tolls affect the key outputs from congestion pricing in New York City — time savings for drivers, revenues that can improve transit service (and, therefore, create time savings for straphangers), environmental benefits, and so forth.
When those positives are netted against tolling’s negatives — administrative costs, drivers’ lost amenity, and the toll costs themselves — the result is the total net societal benefit.
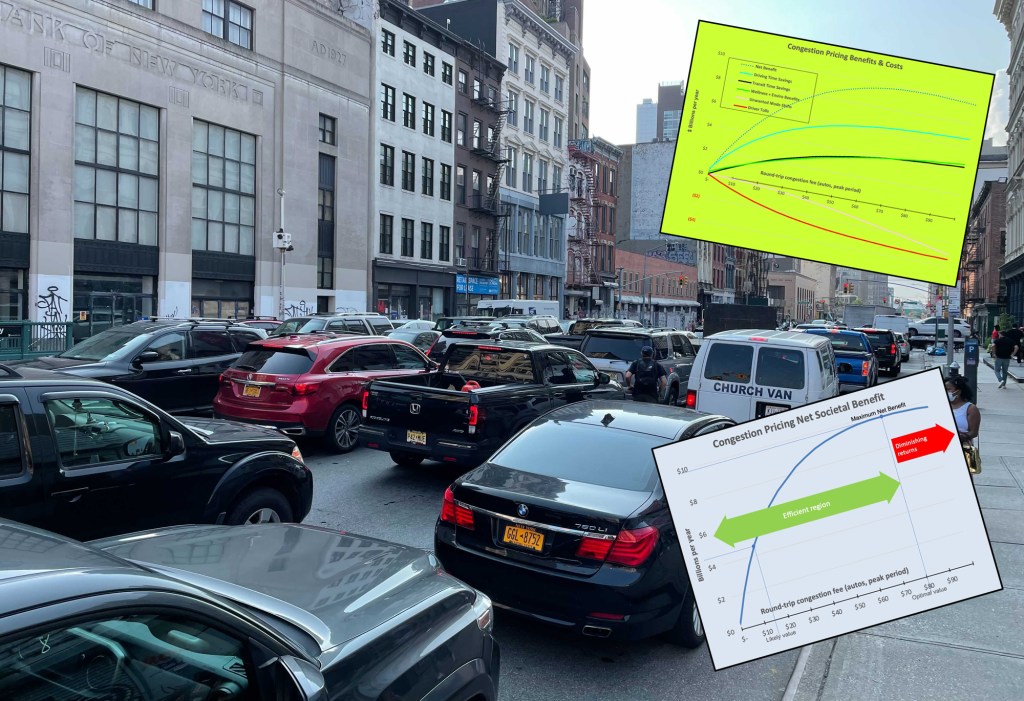
Komanoff said he had never run the BTA model for a series of possible toll levels to track how those outputs rose and fell, so, using the BTA, I ran the numbers with a congestion fee from $0 to $100 in $5 increments. Here’s what I found:
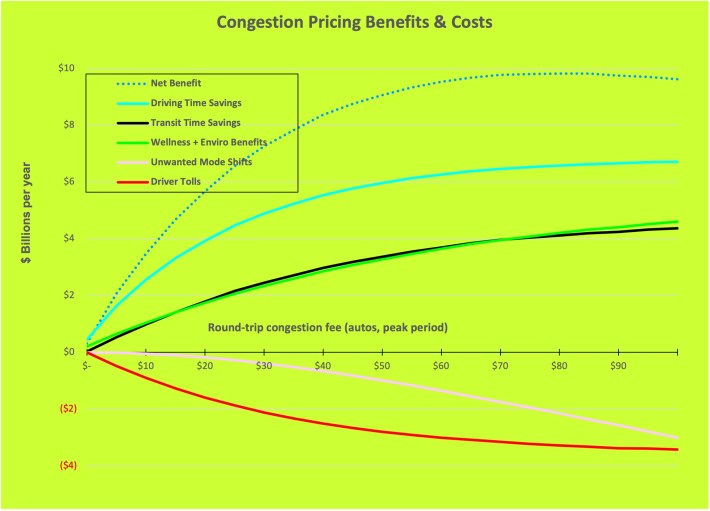
The first thing to notice is that as the toll rises, the net societal benefit goes up, plateaus, then begins to decline. This has to do with the dynamics of the costs and benefits.
The unwanted mode shifts, one of the costs, has an exponential shape, meaning that it starts slowly but, as the congestion fee rises, it increases more and more rapidly, even as other benefits grow. This explains why the net benefit, the summation of all costs and benefits, first rises then falls, reaching a pinnacle in between.
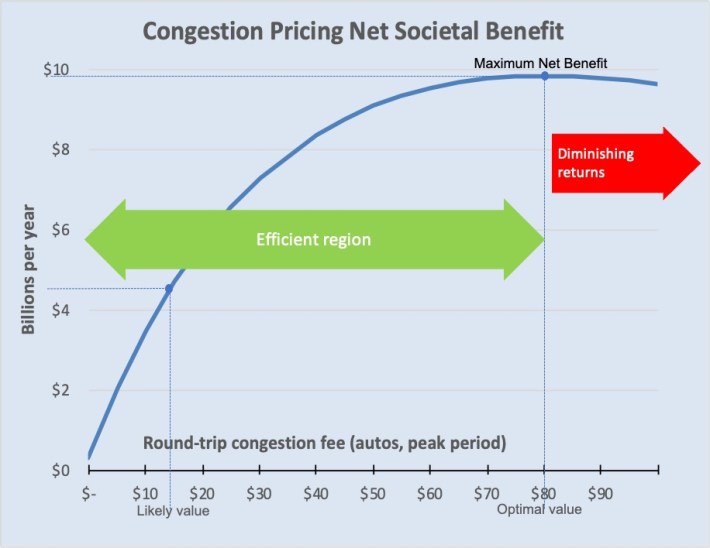
As we can see in the second chart, the congestion fee that maximizes the net benefit is $80, which is nearly six times greater than the likely congestion fee of $13-$15. At the optimal toll level of $80, the net societal benefit is nearly $10 billion per year.
The region to the left of the optimal point is the efficient region, where the time savings and environmental benefits grow faster than the costs. Beyond that point, we enter the region of diminishing returns, where the costs — the higher tolls paid by motorists, along with drivers’ lost amenity from car trips they give up on account of the toll — grow faster than the benefits.
The efficient region in the graph is where tolling delivers the biggest bang for the buck: A $14 congestion toll hits drivers with just 17.5 percent of the optimal toll cost while extracting 45 percent of the maximum net social benefits. That’s efficiency in action!
Now let’s look at another way of determining the optimal congestion fee. Economic theory suggests that in a situation with a negative externality such as traffic congestion, a public policy remedy is to introduce a corrective taxation equal to the marginal cost of the externality.
Let’s unpack this wonky statement: A negative externality happens when a private party uses a public resource, but the cost of using that resource is borne by the public, while the private user does not pay a cent.
This situation is often called the tragedy of commons. Traffic congestion is a negative externality where the common public resource — the road — gets overutilized by its free availability and then doesn’t work for the common good anymore. (Besides traffic congestion, another crisis that falls under the tragedy of commons framework is climate change, since polluters are rarely charged for dumping CO2 into the atmosphere.) The marginal cost in our context simply means collective delay costs borne by all drivers due to an additional vehicle round-trip to the Manhattan Central Business District, the cordoned area.
The marginal delay cost is another one of the BTA’s outputs. Here I’ve plotted it against the congestion fee:
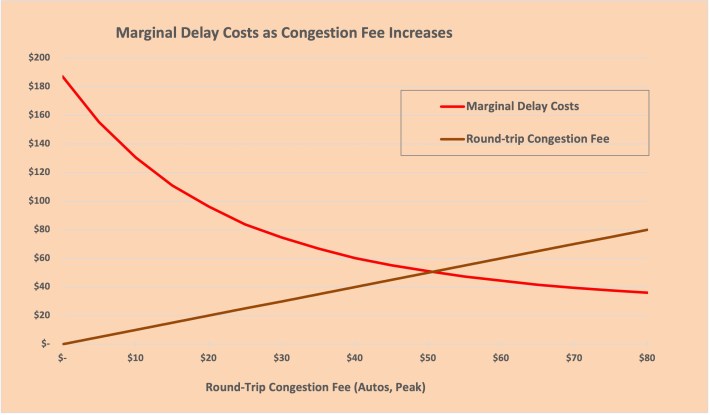
We can see that the marginal delay cost at a congestion fee of $10 is approximately $140. This means that when the congestion fee is only $10, the collective delay imposed on all other drivers by an additional auto trip into the CBD is valued monetarily at $140. At a $20 congestion fee, the congestion is reduced, and as we’d expect the marginal delay cost also goes down (to $100 in this case).
The chart shows the marginal delay cost curve sloping downwards and meeting the rising round-trip congestion fee line at a little over $50. This intersection indicates the toll level for which the marginal delay cost equals the congestion fee. Now recall that the prescriptive public policy remedy for dealing with a negative externality is to charge a corrective tax (our congestion fee!) equal to the marginal cost. So, the theoretically optimal congestion fee should be approximately $50 (lower than our earlier optimal fee of $80 because this chart only looks at one externality: delays for drivers).
So let’s review:
- The round-trip peak congestion fee most likely to emerge from the Traffic Mobility Review Board’s review process is in the $13-$15 range.
- The actual optimal congestion fee, which we calculated in two ways, is in the $50-$80 range.
- The likely congestion fee between $13 and $15 is an efficient range that reaps approximately half the maximum net benefit while charging less than a fifth of the optimal congestion fee.
While it is great that we are extracting nearly half the maximum societal benefit from the likely congestion fee, it’s also unfortunate that we are leaving over half of those potential benefits on the table. That’s a whopping $5.4 billion per year in potential saved time, environmental and wellness benefits. The corresponding toll revenues the MTA would be leaving on the table are more than $2 billion per year.
I’m not advocating charging a congestion fee in the optimal range, but clearly we would do well to stay on the higher side of the likely $13-$15 range. Indeed, examining our second chart closely, one can see that the difference in net societal benefit in going just from a $13 congestion fee to $15 is nearly half a billion dollars per year, an 11-percent increase.
The corresponding toll revenue increase is $140 million/year, or 12 percent. These are resources that the MTA could use for retrofitting subway stations with platform barriers for safety and accelerating CBTC deployment for increased subway speeds.
Gui Larangeira is a Ph.D. student at the State University of New York at Stony Brook, in the Department of Technology and Society. His research focuses on energy and transportation modeling. He also bikes. He can be reached at glarange@gmail.com.

Streetsblog has migrated to a new comment system. New commenters can register directly in the comments section of any article. Returning commenters: your previous comments and display name have been preserved, but you'll need to reclaim your account by clicking "Forgot your password?" on the sign-in form, entering your email, and following the verification link to set a new password — this is required because passwords could not be carried over during the migration. For questions, contact tips@streetsblog.org.