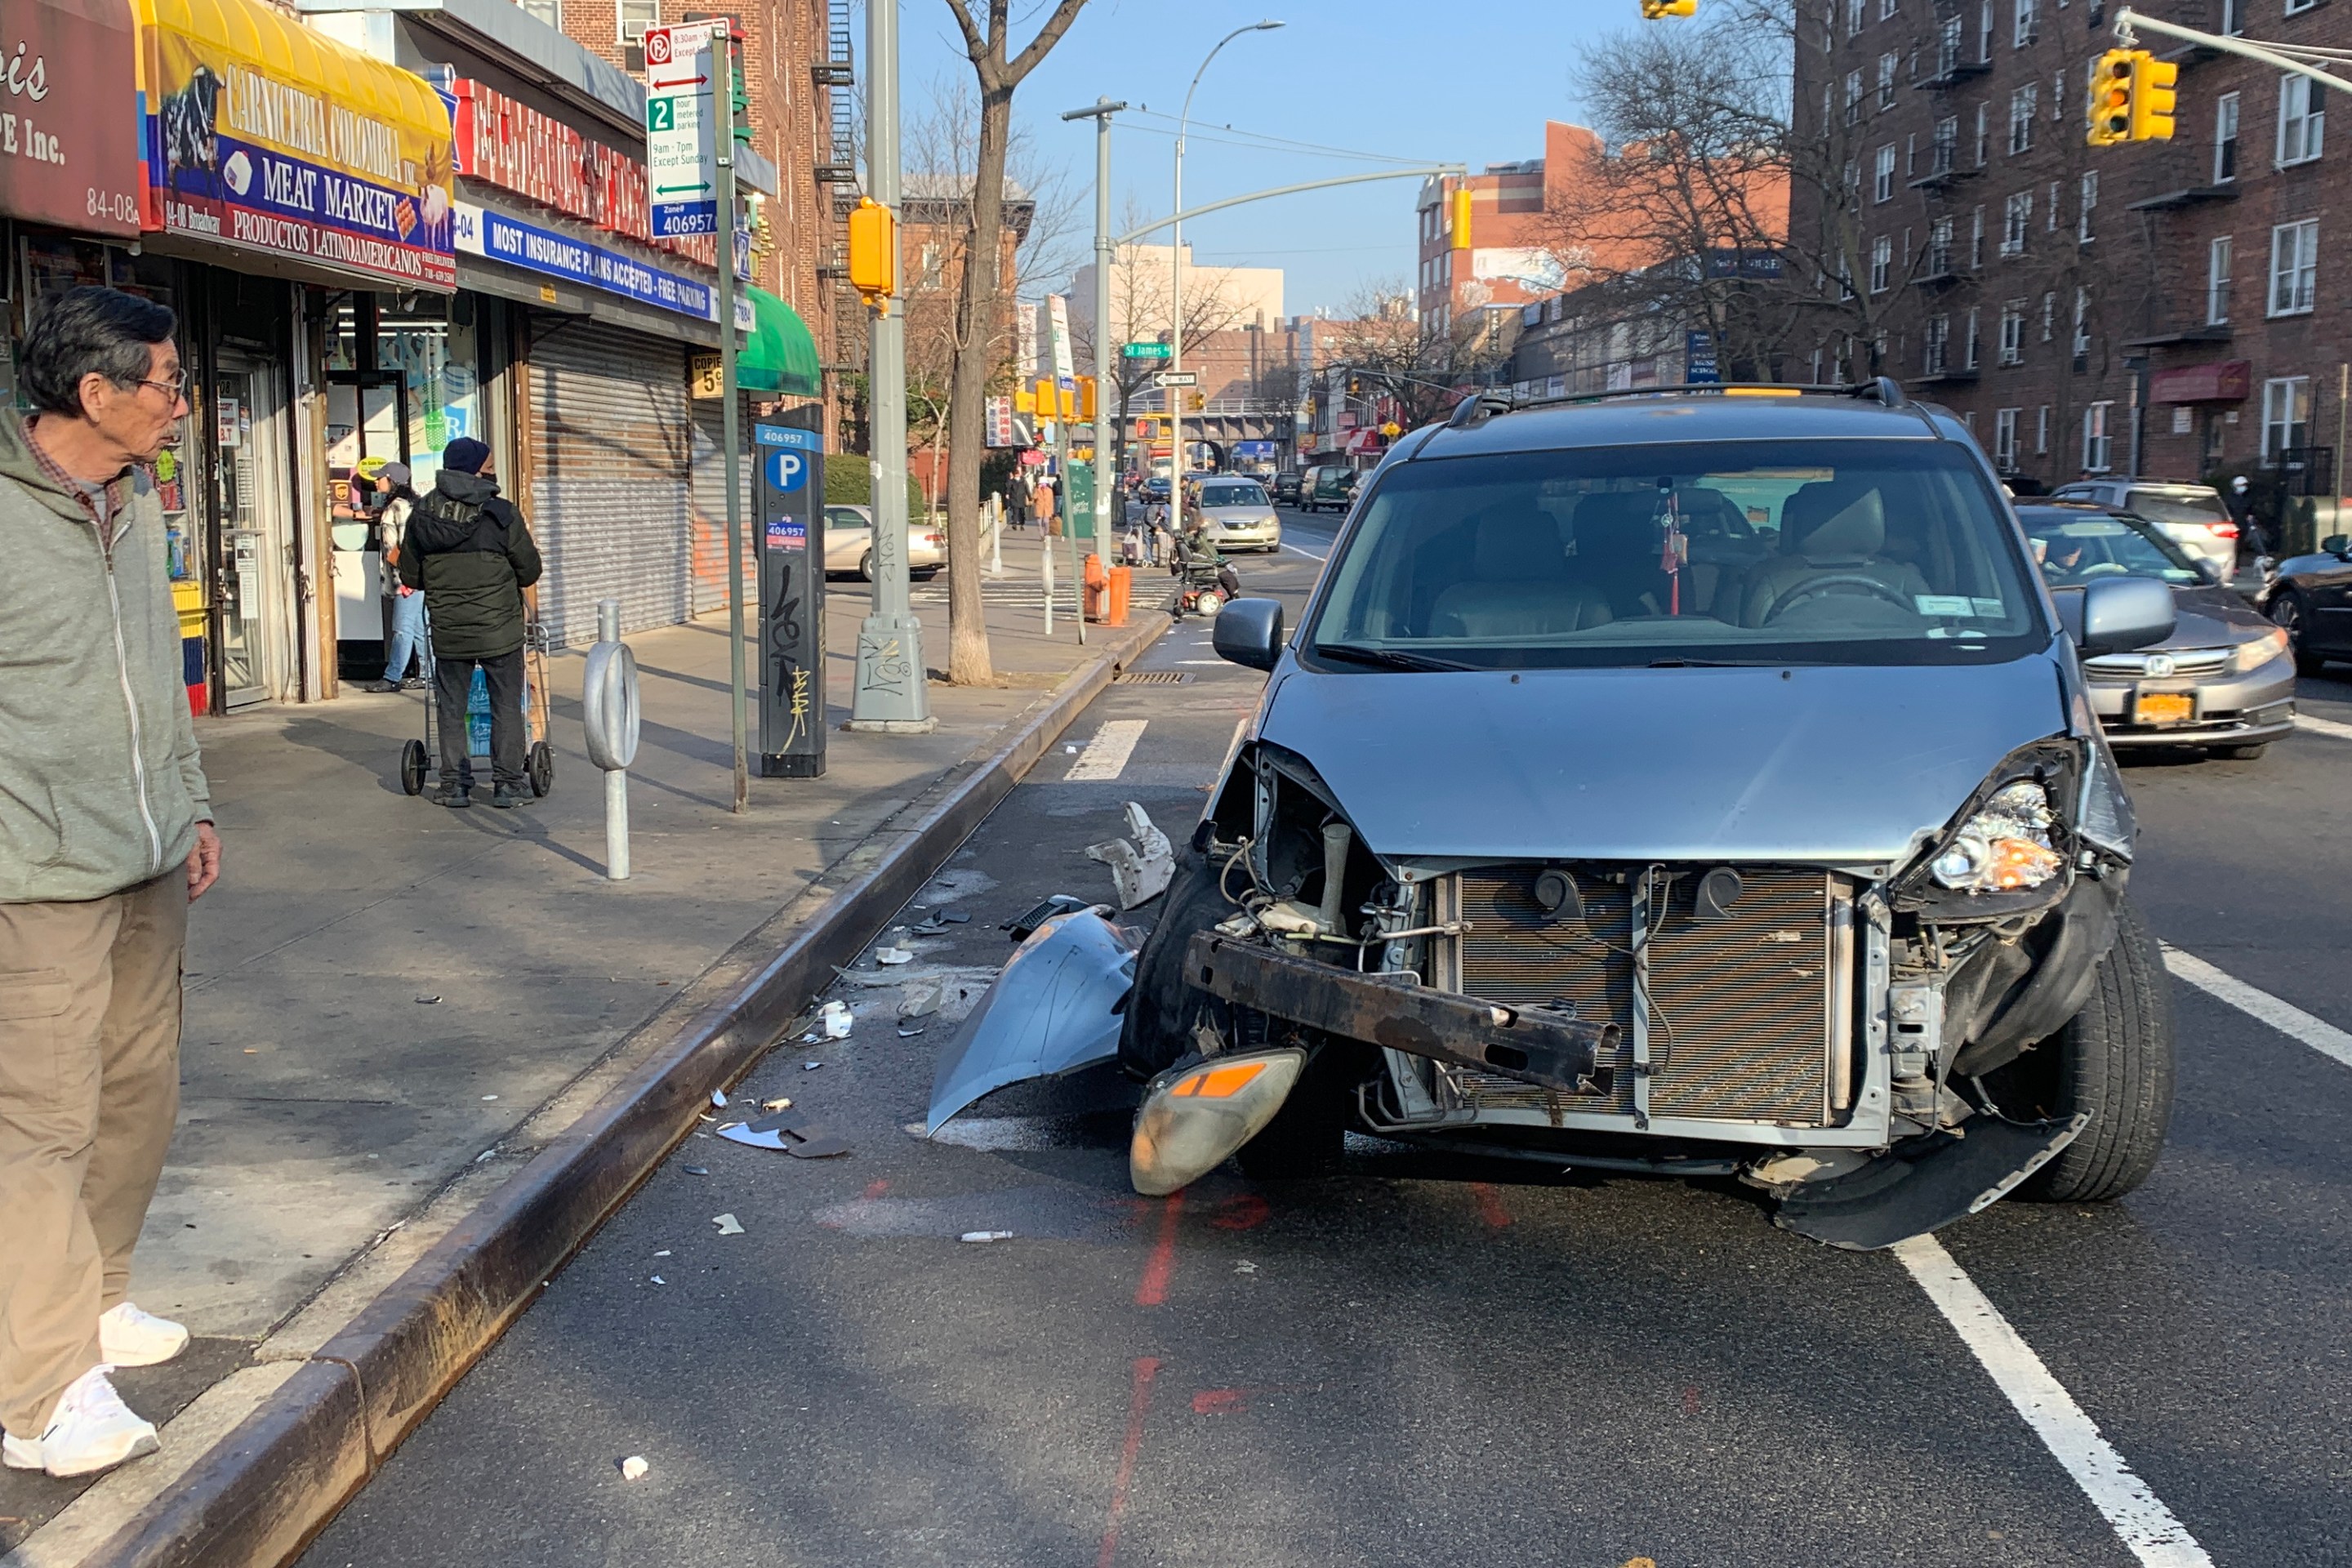
CHEKPEDS has upgraded its crash data map in a big way, giving New Yorkers a powerful tool to push for street safety improvements where they live and work.
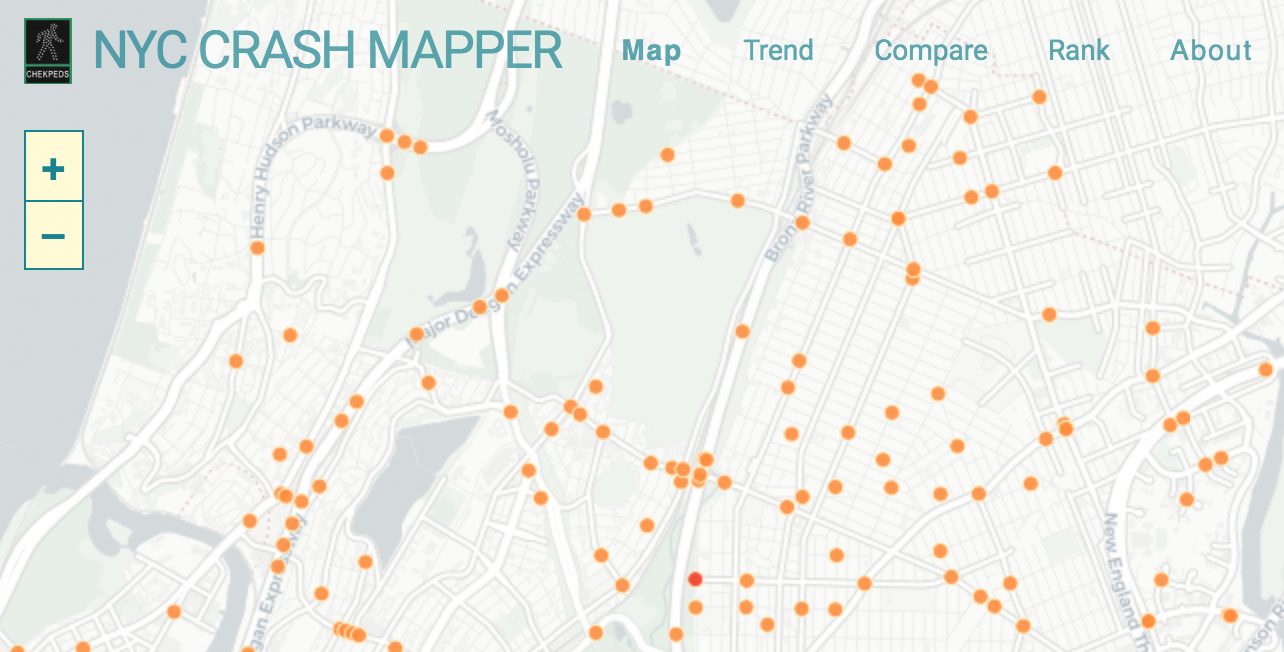
When CHEKPEDS introduced Crash Mapper a year ago, it was already an improvement over City Hall's Vision Zero View. Crash Mapper uses the same data as the city map, but the public can do a lot more with it.
Let's start with the basics. When you click on an intersection with a history of crashes, Vision Zero View can only show you the number of victims at that location during a particular month or year. It takes additional steps to determine whether victims were walking or biking, or were in a motor vehicle, and users have to toggle between injury and fatality data.
Crash Mapper lets the user define the time frame and with one click shows the total number of fatal and injury crashes for a given intersection, sorted by mode of travel.
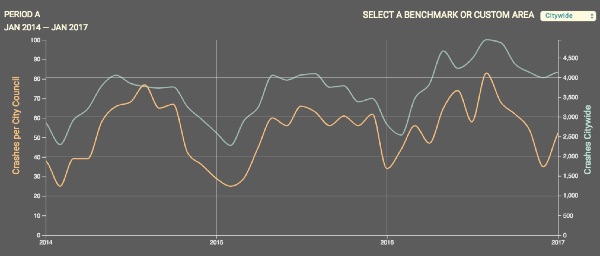
The Crash Mapper reboot was developed in conjunction with Greeninfo Network and CARTO with funding help from Manhattan Borough President Gale Brewer and the City Council speaker's office. Like before, it allows users to draw custom areas on the map and analyze those sections using any of the data sorting functions. Among the upgrades: the map now creates unique URLs so search scenarios can be preserved. You can outline an area to compare crash stats before and after a specific street improvement, like a bike lane, and easily show the results to other people.
Data can also be filtered and compared by borough, community board, council district, police precinct, neighborhood, and intersection. With the expanded functionality, you can view data trends in, say, your community district side by side with the borough as a whole, for a time period of your choosing.
Crash Mapper can rank dangerous intersections within a given area in real-time. Are the corridors prioritized for safety fixes in DOT's 2015 borough pedestrian safety action plans still the most dangerous? What are the most crash-prone intersections in your local police precinct? Want to know if that bike lane mixing zone is a hot spot for collisions? Crash Mapper can answer those questions and give you the data you need to press officials to take action.
“With a few clicks, crashmapper.org makes available to all -- activists, press, elected officials, agencies, police precincts, community boards, and business improvement districts -- the information necessary to evaluate in minutes instead of days the safety of our streets, and request remedies accordingly,“ said CHEKPEDS in a statement.
The Crash Mapper “help” page features video tutorials on how to get the most out of the map. We're still playing around with it, but there's no doubt it will inform Streetsblog coverage of crashes and the movement for safer NYC streets.
Read More:
Stay in touch
Sign up for our free newsletter
More from Streetsblog New York City
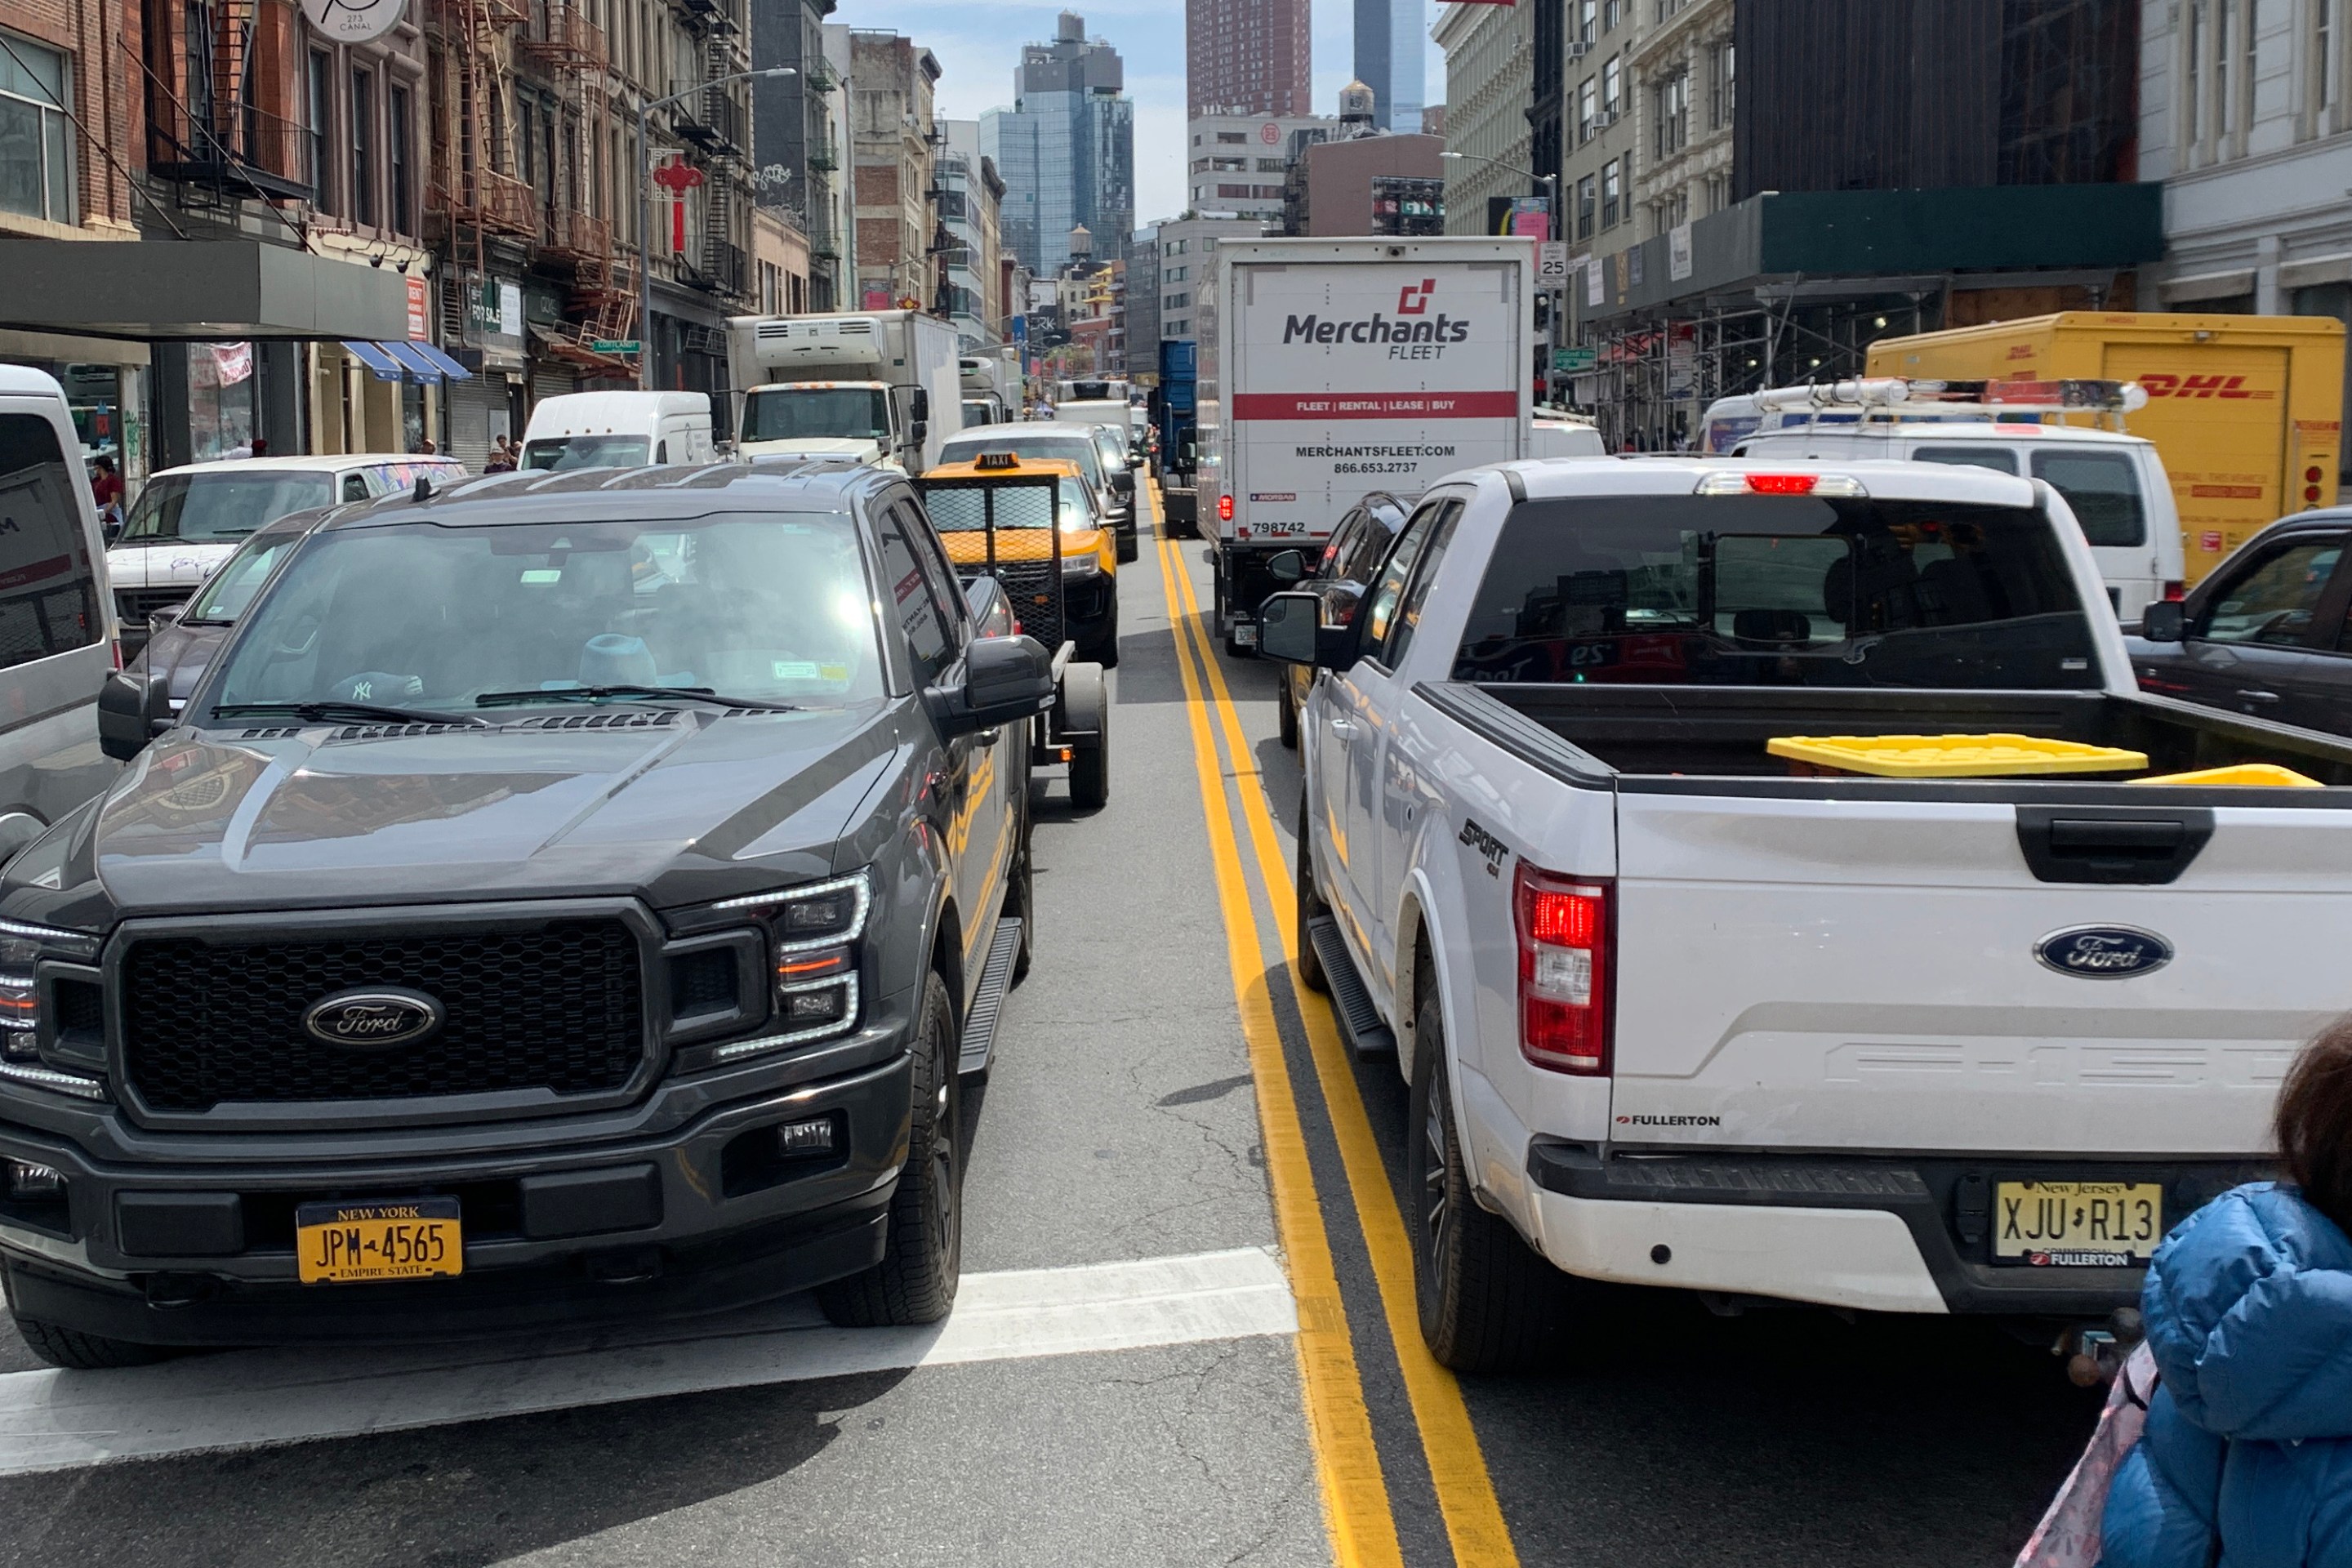
Friday’s Headlines: Canal Street Follies Edition
Manhattan Borough President Mark Levine isn't happy. Plus otherness.
Daylight Again: Bronx Community Board Backs Parking Ban at Intersections
The Boogie Down is down with daylighting!
Community Board Wants Protected Bike Lane on Empire Blvd.
Brooklyn Community Board 9 wants city to upgrade Empire Boulevard's frequently blocked bike lane, which serves as a gateway to Prospect Park.
The Brake: Why We Can’t End Violence on Transit With More Police
Are more cops the answer to violence against transit workers, or is it only driving societal tensions that make attacks more frequent?
Report: Road Violence Hits Record in First Quarter of 2024
Sixty people died in the first three months of the year, 50 percent more than the first quarter of 2018, which was the safest opening three months of any Vision Zero year.