As City Hall staffers work on improvements to Vision Zero View, hopefully they're taking cues from Transport for London’s collision map.
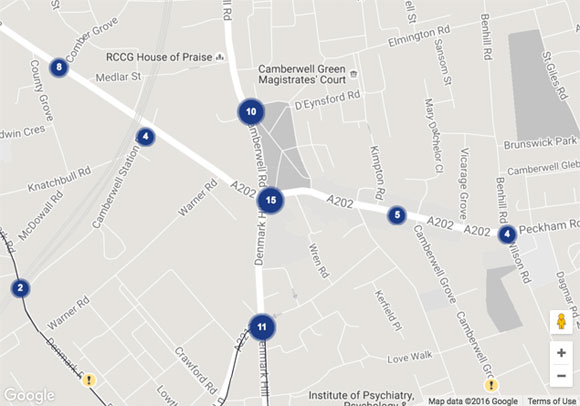
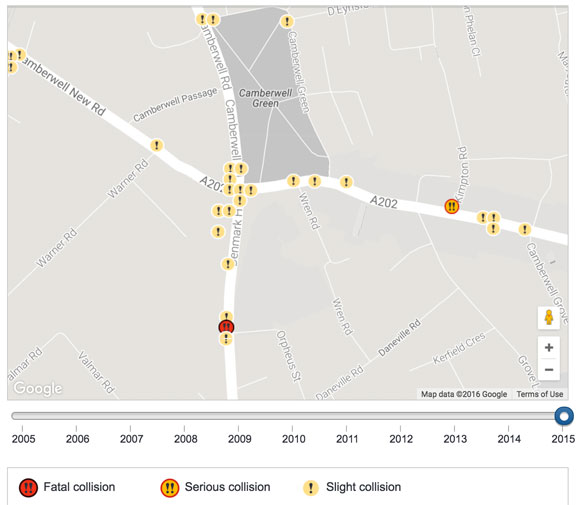
Launched last September, the TfL map “shows traffic collisions that resulted in personal injury and were reported to the police” from 2005 through 2015.
Some features of the TfL map that Vision Zero View doesn't currently have:
- Crashes are searchable by the severity of injury ("serious" or “slight”), whereas Vision Zero View lumps all non-fatal injury crashes together -- this is important because the rate of serious injuries is considered a better measurement of street safety than the rate of fatalities or total injuries;
- You can see fatal and injury crashes simultaneously, and icons for individual crashes vary based on injury severity, while on Vision Zero View fatalities and non-fatal injuries can only be viewed separately;
- Summaries of individual crashes include vehicle types involved, the time of day each crashed occurred, and information on resulting injuries.
Streetsblog reader Robert Wright pointed me to the location where he was struck by a driver in 2009. The map described the crash like so:
On 04 February 2009 at 09:40:00 a collision occurred at Brixton Road junction with Groveway in Lambeth involving a light goods vehicle and a pedal cycle. An adult pedal cyclist was slightly injured.
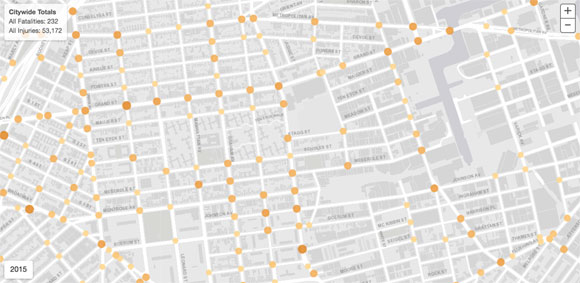
One significant advantage of Vision Zero View, meanwhile, is that data is updated each month, while London only posts annual datasets. The current NYC map also includes info on street safety measures and speed limits, and categorizes injuries per square mile broken down by police precinct, city council district, and community district.
Another superior aspect of Vision Zero View is that you can see specific crash locations even if you're not zoomed in very far -- you have to zoom out a few levels to trigger the "heatmap" mode -- while on the London map, you have to go in tight to see individual crashes. It's easier to get a sense of dangerous locations looking at the NYC map.
Still, there are very useful details in the data made public by TfL that NYC should emulate.
