ANALYSIS: Congestion Pricing Will Lead to Better Air Quality in The Bronx
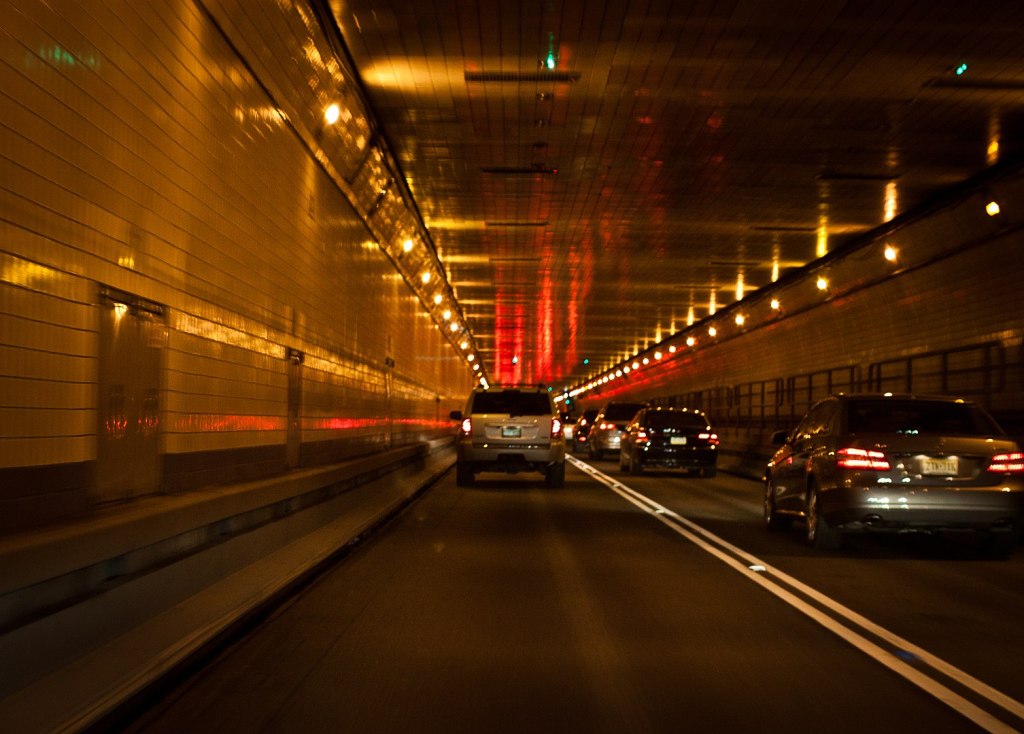
Air quality and public health in the Bronx will receive a boost from congestion pricing, even under a toll scenario that diverts substantial truck traffic from midtown onto bridges and highways north of the Manhattan core.
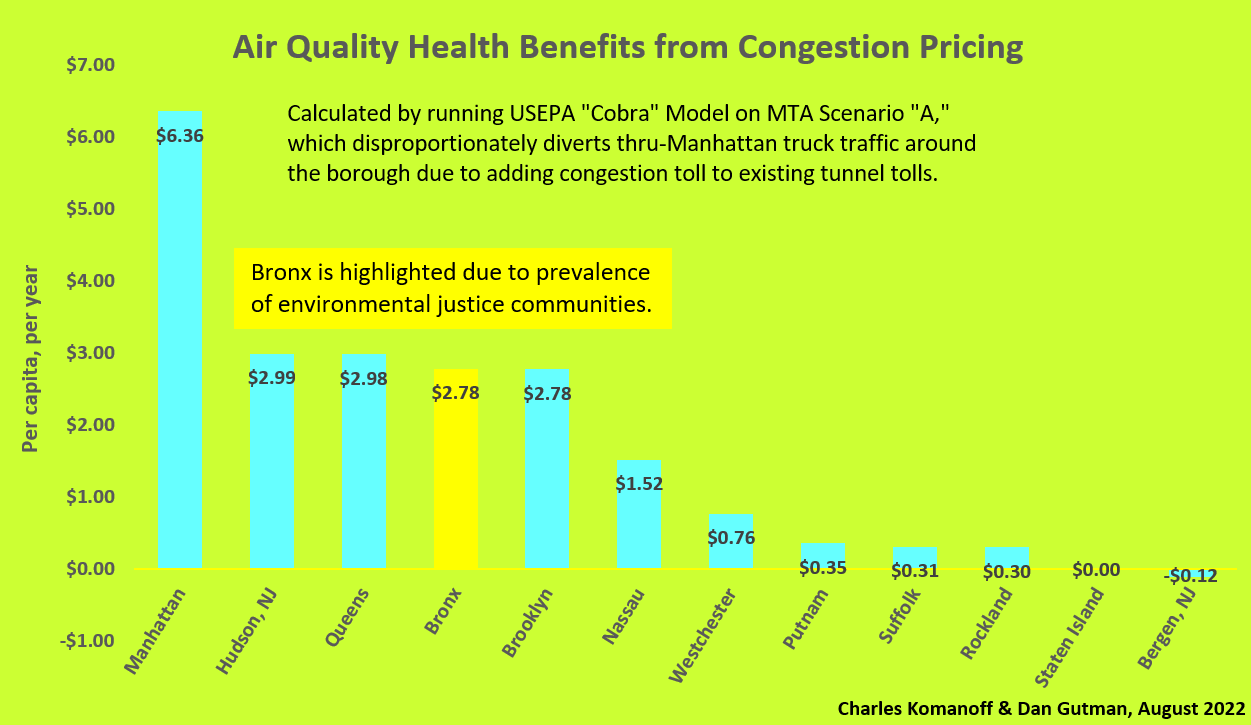
Manhattan air quality improves the most, not surprisingly, because that borough is projected to experience the biggest drop in vehicular traffic once cars and trucks are charged a fee to drive into Manhattan south of 60th Street. Under the toll scenario that the MTA scrutinized for emissions in its environmental assessment of congestion pricing, Hudson County (N.J.), Queens, The Bronx and Brooklyn also benefit considerably, with air-quality health benefits nearly half as large as Manhattan’s, on a per-capita basis.
The positive Bronx result, although modest, is noteworthy because of concerns that congestion pricing may lead to increased vehicular travel in The Bronx. In the lone toll scenario scrutinized for emissions by the MTA, Scenario “A,” disproportionately heavy tolling of the Lincoln and Holland Tunnels triggers substantial diversion of east-west auto and truck trips to the Cross-Bronx Expressway and other highways north of mid-Manhattan, resulting in an overall increase in vehicle miles traveled in The Bronx.
Increases in VMT ordinarily bring higher tailpipe emissions and worsened air quality. But ambient air concentrations of fine particulate matter (PM2.5), the cause of most pollution-related health impacts from vehicular traffic, arise not only from tailpipes (and brake and tire wear) but also from atmospheric conversion of emissions of nitrogen oxides and volatile organic compounds. The “decoupling” in our results of Bronx pollution concentrations, which would fall slightly, from slightly rising Bronx vehicle travel in the scenario studied, comes about because reduced vehicle travel and emissions in Manhattan, Queens, Brooklyn, Westchester County and Rockland County lead to diminished particulate formation over the Bronx and lower atmospheric transport of PM2.5 into the Bronx. The net result is that less particulate matter will be present in Bronx air with congestion pricing, and per-capita health benefits will, accordingly, be roughly the same as for Queens, Brooklyn, and Hudson County.
Air Quality Methodology
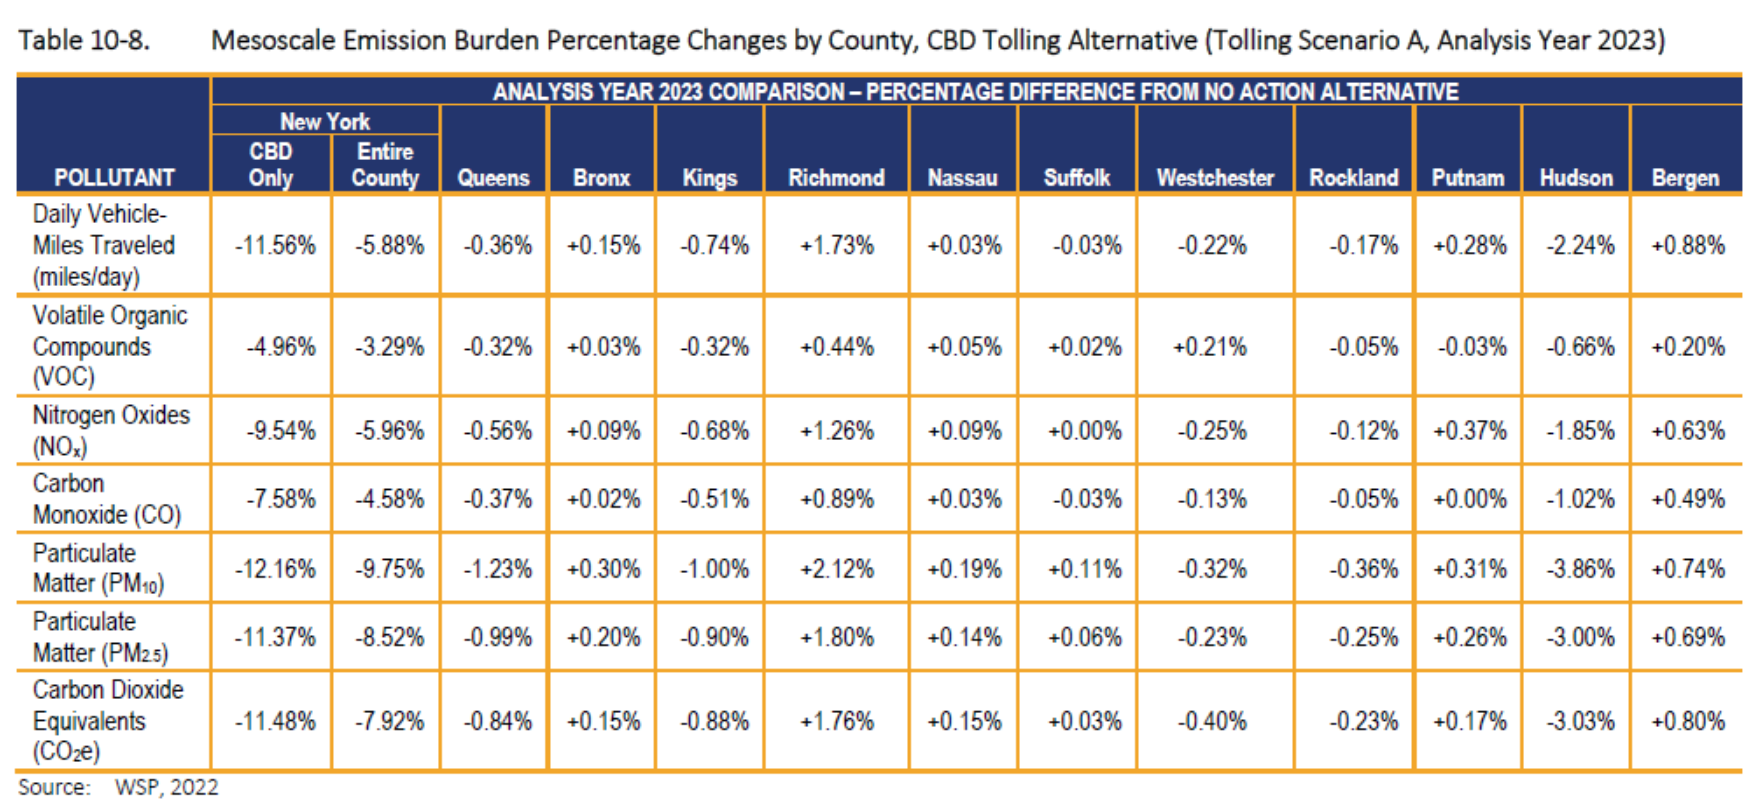
The MTA’s environmental assessment projects incremental changes in each county’s vehicular emissions, including emissions of fine particulate matter (PM2.5), the pollutant most injurious to human health — though only for Toll Scenario “A.” The changes are presented in the MTA assessment’s Table 10-8, which we have reproduced here:
Overall emissions are projected to decline with congestion pricing, although in some counties emissions will increase slightly. Nevertheless, a slight increase in emissions in one county does not necessarily mean that health impacts in that county will worsen, for two reasons.
First, air emissions travel between and among counties depending on wind direction. So reductions in direct PM2.5 emissions could spill over into a neighboring county. Second, and more importantly, a large fraction of PM2.5 concentrations at ground level comes from particulate matter formed by chemical reactions in the atmosphere involving “precursor emissions” from nearby or distant areas. Lower emissions of precursor gases in those areas can lead to lower PM2.5 concentrations elsewhere, even in places where directly-emitted PM2.5 increases.
Motor vehicles emit PM2.5 directly from tailpipes as well as via brake and tire wear. They also emit precursor gases such as nitrogen oxides (NOx) and volatile organic compounds (VOCs) that form particulate matter in the atmosphere.
To assess health impacts of PM2.5, we must consider the impact of indirect as well as direct sources of PM2.5. A straightforward model that does so is COBRA — CO-Benefits Risk Assessment — a tool designed by the Environmental Protection Agency to compare the PM2.5 health impacts of various policy options. COBRA takes estimated changes in county air emissions and calculates changes in PM2.5 concentration and health impacts in that county and in neighboring counties. We entered the MTA’s estimates of the percentage changes in direct PM2.5 emissions as well as emissions of NOx and VOCs for each county from Table 10-8, shown above, into the COBRA model and ran it for the year 2023.
The results indicate that changes in air-pollution-related health impacts will be small — but positive overall.
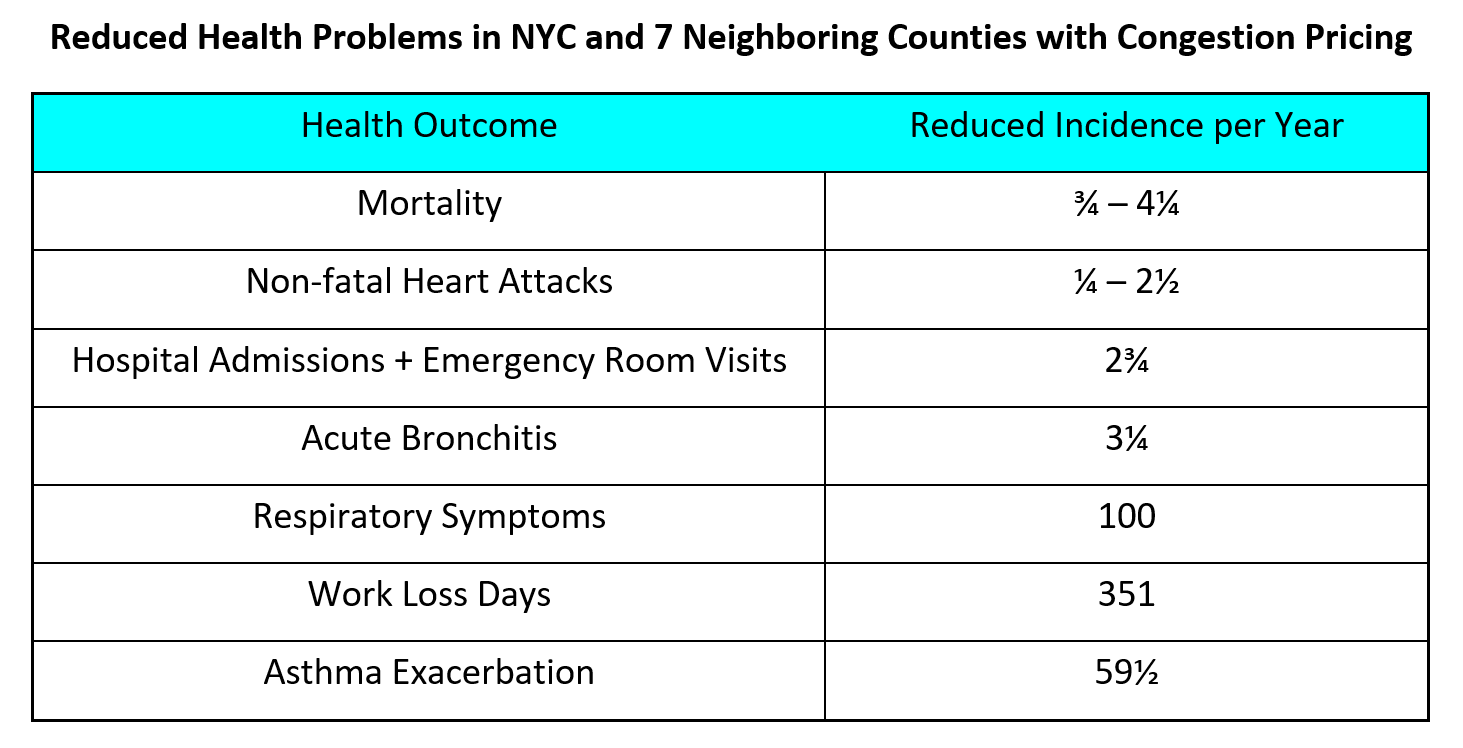
Because of PM2.5’s transport across county boundaries and the atmospheric formation of PM2.5 from regional precursor emissions, health benefits are spread more evenly across the 12-county region than might be indicated by more widely varying projections of raw emissions or VMT.
For example, the MTA’s projections show the Bronx experiencing increased VMT and increases in PM2.5, NOx, and VOC emissions. Nevertheless, our analysis using COBRA shows that lesser atmospheric PM2.5 formation, along with lower transport of PM2.5 from neighboring counties to the Bronx, will provide overall positive health benefits to Bronx residents.
Our analysis, which, again, is based on the MTA’s emissions projections for its draconian Scenario A, shows that only one county, Bergen, in northern New Jersey, will have negative health impacts, on account of trip diversions from the Lincoln Tunnel to the George Washington Bridge. These negative impacts for Bergen County are projected to be slight, as seen in the bar chart on page 1. Moreover, they will almost certainly disappear for toll scenarios that credit, rather than add to, existing tolls to enter Manhattan via the Lincoln Tunnel.
COBRA also provides estimates of the monetary value of health benefits. For the 12 counties analyzed by the MTA, total health benefits in 2023 from congestion pricing are valued by COBRA at $20.8 million. A useful way to illustrate the distribution of these health benefits among counties is to compare their monetary value per capita, as we have done in the bar chart in the Summary above.
Limitations
COBRA, which is the EPA air quality and health impacts model we employed in our analysis, yields only county-wide results. Thus, the key air-quality finding for The Bronx — a six-hundredths of one percent reduction in concentrations of PM2.5 (fine particulate matter) in ambient air, for the toll scenario that would dump considerable diverted traffic into that borough — is an all-county average and only partially offsets increased (worsened) pollution concentrations in the immediate vicinity of some highways.
Mitigation
Environmental justice and transportation advocates have advanced an impressive menu of measures to avert localized worsening of ambient air pollution on and near major highways that, under some MTA tolling scenarios, are projected to undergo increased vehicular emissions from the diversion of heavy trucks and other motor vehicles trying to avoid the new CBD tolls.
For The Bronx, these measures include accelerating the MTA’s conversion of combustion buses to electric vehicles on routes served from the Kingsbridge and Gun Hill depots; incentivizing the long-overdue electric conversion of over-the-road and local trucks that deliver to and pick up from the Hunts Point Market; and capping substantial stretches of the Cross-Bronx Expressway, as championed by advocates and the area’s Congress member, Ritchie Torres. Torres has also proposed replacing the four gas-fired “peaker” power plants in the South Bronx Port Morris district with solar capacity.
Intensive, transparent, before-and-after local air pollution monitoring is also essential, both to gain trust of affected communities and to ensure that these and allied mitigation measures are expedited and maintained as necessary to prevent congestion pricing from creating pollution “hot spots” outside the congestion tolling zone.
A Key Conservatism
“Conservatisms” denote assumptions or methods that tend to downplay positive findings.
The major conservatism in our analysis, and it is a large one, is that the toll design it assumes, the MTA’s “Scenario A,” is tailor-made to route heavy trucks — by far the largest emitters of PM2.5, the most health-harming pollutant — around the Manhattan core. The scenario’s key feature, and likewise for its sibling Scenario B, is the absence of toll credits for the four river-crossing tunnels serving Manhattan south of 60th Street: the Lincoln and Holland Tunnels under the Hudson River, and the Brooklyn-Battery and Queens-Midtown Tunnels under the East River.
Large trucks are already heavily tolled at those tunnels. A five-axle truck, which can range in weight up to 78,000 pounds, today pays $95.00 to enter Manhattan via the Lincoln and Holland Tunnels (off-peak discounts reduce that toll, but only to $82.50). The same truck pays $28.40 in each direction to enter or leave Manhattan via the Brooklyn-Battery and Queens-Midtown Tunnels. Scenario A would tack another $20.00 to $40.00 on top of those tolls, incentivizing trucks whose origin and destination lie outside the Manhattan core to circumvent direct midtown routes and instead use circumferential bridges and expressways.
Consider trucks traveling eastbound between the industrial centers of Secaucus, N.J., and Maspeth, Queens. Some truck drivers today elect to drive through midtown Manhattan, shouldering the heavy Lincoln Tunnel toll rather than adding miles (and, likely, minutes) to skirt Manhattan by way of the George Washington Bridge, the Trans-Manhattan Expressway and the Cross-Bronx. Under MTA Scenario A, the additional $20 to $40 congestion toll will draw some of those trips away from the Lincoln and to the circumferential route.
As a result, Scenarios A and B appear to divert more truck traffic to the Bronx than do the other five scenarios, C through G, which “credit” tunnel trips for paying existing tolls instead of adding to the charges. Thus, Scenario A — the sole scenario for which the environmental assessment provides pollution increments or decrements (as shown in the assessment’s Table 10-8, which we reproduced above) — almost certainly (along with Scenario B) represents a worst case for Bronx air pollution impacts from congestion pricing.
Other conservatisms
Another conservatism in our analysis is one that appears to have been baked into the MTA’s environmental assessment: Reductions in car travel caused by future transit improvements paid for with congestion pricing revenues apparently are not credited, presumably because those improvements will take time to materialize fully. As they do, they will improve air quality not only by removing more vehicles from the roads but also by increasing highway and street travel speeds and thus enabling trucks to travel slightly faster, reducing their emissions. Those benefits are not counted here, however.
Finally, non-air quality benefits to health do not appear to have been included in the environmental assessment — at least not in the top-line results. VMT reductions generate not just improved air quality but greater participation in “active” travel (walking and cycling) and, thus, quality and longevity of life, as well as fewer crashes and quieter streets, which bring their own health benefits. These, too, would become more pronounced over time as more congestion revenues are transmuted into improved public transit and lower VMT.


Read More:
Streetsblog has migrated to a new comment system. New commenters can register directly in the comments section of any article. Returning commenters: your previous comments and display name have been preserved, but you'll need to reclaim your account by clicking "Forgot your password?" on the sign-in form, entering your email, and following the verification link to set a new password — this is required because passwords could not be carried over during the migration. For questions, contact tips@streetsblog.org.