Map the Dangerous Streets in Your Neighborhood With This New Tool
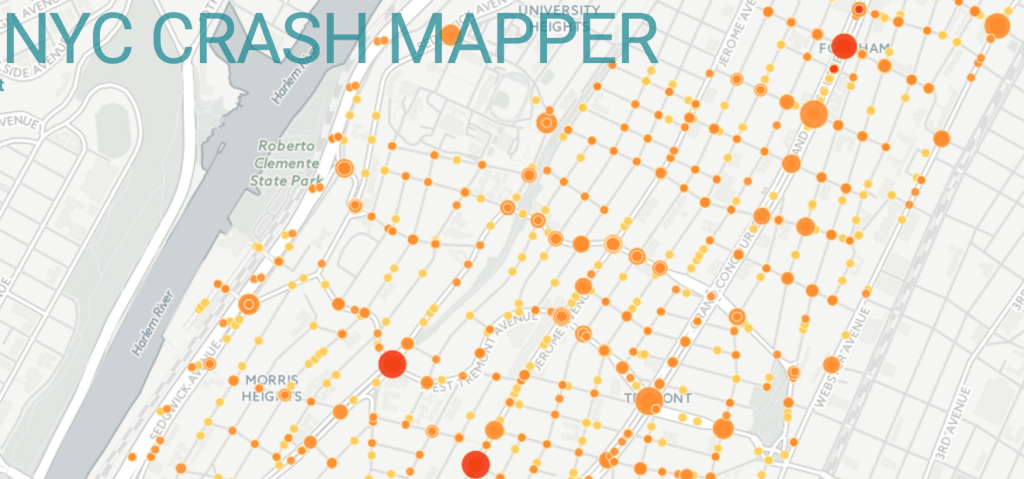
The street safety advocates at Hell’s Kitchen-based Chekpeds have relaunched NYC Crash Mapper, a tool lets you drill down on traffic crash data in your neighborhood, community board, or City Council district.
The new Crash Mapper interface is a step up from City Hall’s Vision Zero View tool, which launched in 2014, in some important ways.
The main difference is “customized filtering.” On Vision Zero View, there is little flexibility to break down traffic crashes within a given area or time frame. It displays crash totals for specific months or years, and the ability to get fine-grained information for specific geographic areas is limited. Crash Mapper, meanwhile, lets you query data from any date range and break down different types of crashes within neighborhoods, police precincts, or council districts. If those geographic categories don’t cut it for you, the map also lets you designate custom boundaries.
Crash Mapper is also updated as soon as NYPD crash data becomes available, while Vision Zero View is updated monthly.
T.A. first launched an online crash mapping tool in the late 1990s with CrashStat, and since then the concept has gone through several iterations.
Chekpeds enlisted developer Chris Henrick to create this version in coordination with developer John Krauss, who designed the earlier version of the tool, and the mapping software company CARTO.
Chekpeds’ Christine Berthet said the new features in Crash Mapper should prove useful for neighborhood-level street safety advocacy. If parents want to make the case for safety improvements around their children’s school, for example, the tool allows them to easily identify the dangerous locations in need of attention.
“It’s very important that we look at the safety issues in terms of data and that we are really focusing on the most important intersections, the most dangerous, because our resources are finite,” said Berthet. “For a safety advocate, I think having the data in a very easy and usable way is, to my mind, critical to our mission.”

Read More:
Streetsblog has migrated to a new comment system. New commenters can register directly in the comments section of any article. Returning commenters: your previous comments and display name have been preserved, but you'll need to reclaim your account by clicking "Forgot your password?" on the sign-in form, entering your email, and following the verification link to set a new password — this is required because passwords could not be carried over during the migration. For questions, contact tips@streetsblog.org.