DOT Posts East River Bridge Bike Counts, But Not as Open Data
DOT has posted detailed bike counts from the four East River bridges from April through July of this year, a promising new step in making its data on bicycling publicly available. The data was released as monthly PDFs that include bike counts on each bridge, cumulative precipitation, and temperature ranges for each day.

It’s the first time DOT has published such granular information. But the release would be better if the counts were published as a feed on the city’s open data portal, which would make it much easier to analyze the information.
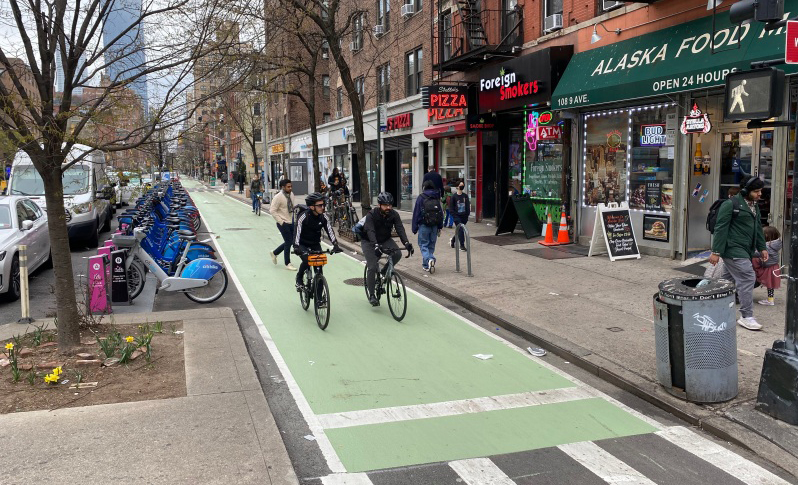
DOT has been counting bicyclists on the Manhattan, Brooklyn, Williamsburg, and Queensboro bridges since the 1980s, but only since 2014 has it deployed automated counters to collect a more robust data set. The city used to only count bicyclists a few days out of each month. Now it counts every day.
Last year’s “screenline” bike counts (which include the Staten Island Ferry Whitehall Terminal and the Hudson River Greenway at 50th Street, in addition to the bridges) were not released until this past May. Not only will the timely release of data speed up public access, but the greater detail in these spreadsheets can also lead to a better understanding of how factors like temperature or precipitation affect cycling rates.
To measure changes in cycling volumes, DOT uses counts from weekdays without precipitation, to ensure that it is comparing apples to apples. Using this method, the new counts show that the number of cyclists riding over the bridges increased by 7.9, 7.2, 10.3 percent respectively in April, June, and July, compared to the same months the previous year. In May, the count decreased 3.7 percent.
The data that gets discarded for the purposes of measuring bike count trends could still be useful. You could assess how variables like temperature or rain affect cycling levels, for instance. That analysis — or any other analysis, really, like tracking trends on individual bridges — would be a lot easier if the bike counts were published on the open data portal.
Currently, a search of the portal for bike counts only turns up a batch of 2014 counts from Manhattan streets and greenways posted by the Department of City Planning. We have an inquiry in with DOT about whether the agency plans to post these monthly bike counts on the open data portal.

Streetsblog has migrated to a new comment system. New commenters can register directly in the comments section of any article. Returning commenters: your previous comments and display name have been preserved, but you'll need to reclaim your account by clicking "Forgot your password?" on the sign-in form, entering your email, and following the verification link to set a new password — this is required because passwords could not be carried over during the migration. For questions, contact tips@streetsblog.org.