What Gertrude Stein said about Oakland is what must be said about City Hall’s new traffic study: There’s no there there.
A research effort that was going to explain how congestion in Manhattan has increased even as vehicle trips to the core have dropped has shrunk to a 12-page report bereft of conclusions supported by evidence.
It may be true, as the report claims, that increases in Uber traffic in the Central Business District (CBD) have been largely offset by decreases in trips by traditional yellow cabs, leading to little or no net traffic impact. But as best as I can tell, that assertion is based on hypothetical 2010 and 2020 traffic estimates plucked from a NYC travel model and interpolated to 2014 and 2015.
Not only is this kind of interpolation volatile and unreliable, it should have been unnecessary since yellows are fully (and competently) tracked by the Taxi and Limousine Commission while Uber was opening its books to the city’s consultant.
The question of Uber “substitution” or “additionality” vis-à-vis yellow cabs was the presumed fulcrum of the $2 million study. Ignoring the wealth of data tailor-made to answer that question, and relying on constructed numbers instead, as the study appears to have done, is dumbfounding.
The City Hall report is almost as opaque in its asserted findings of factors that have contributed to increased congestion. Here’s a rundown:
- “Construction permits in the CBD are up 6-7 percent since 2009.” That’s a surprisingly modest increase, given that 2009 was the bottom year of the Great Recession. Even so, with no physical representation of the increase (e.g., lane-miles removed from service), there’s no way to use the figure to gauge the traffic impact of the construction boom.
- “Pedestrian counts in the CBD are also up 18-24 percent since 2009.” That’s heartening. But the report doesn’t say if the increase was measured throughout the CBD or just in a few hot spots like Times Square. And surely DOT or its consultant have a model to tell whether such an increase would slow motor traffic a lot or a little... don’t they?
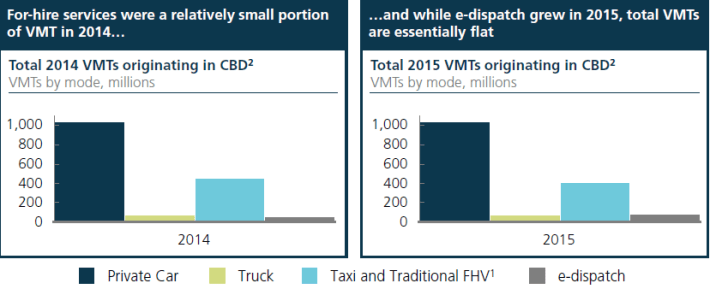
- The report also points to an unspecified “growth in the number of deliveries,” meaning more truck traffic, which DOT could easily track. But no numbers are given, and the VMT (vehicle miles traveled) bar graph in the report (page 5), while maddeningly hard to read, doesn’t suggest a sizeable increase in trucks.
One further problem: The VMT graph suggests that yellow cabs still accounted for as much as 85 percent of for-hire vehicle traffic in the CBD last year, meaning only 15 percent for Ubers and other “e-dispatch” cars. But last summer the data jockeys at the New York Times Upshot desk concluded that Uber’s market share was already up to 25 percent. The 10-point discrepancy is troubling, both because minor increments in vehicles can touch off big drops in CBD traffic speeds, and because it reinforces the inference that the report relied on theoretical instead of actual vehicle counts.
Parsing the decline in Manhattan travel isn’t simple, as I know from trying it last summer. I think my effort was a good first cut, though I’m chagrined I overlooked increased construction as a possible factor.
But the City Hall report reads like the work of people who were only half-trying. Traffic is a serious business. New Yorkers deserve better.

