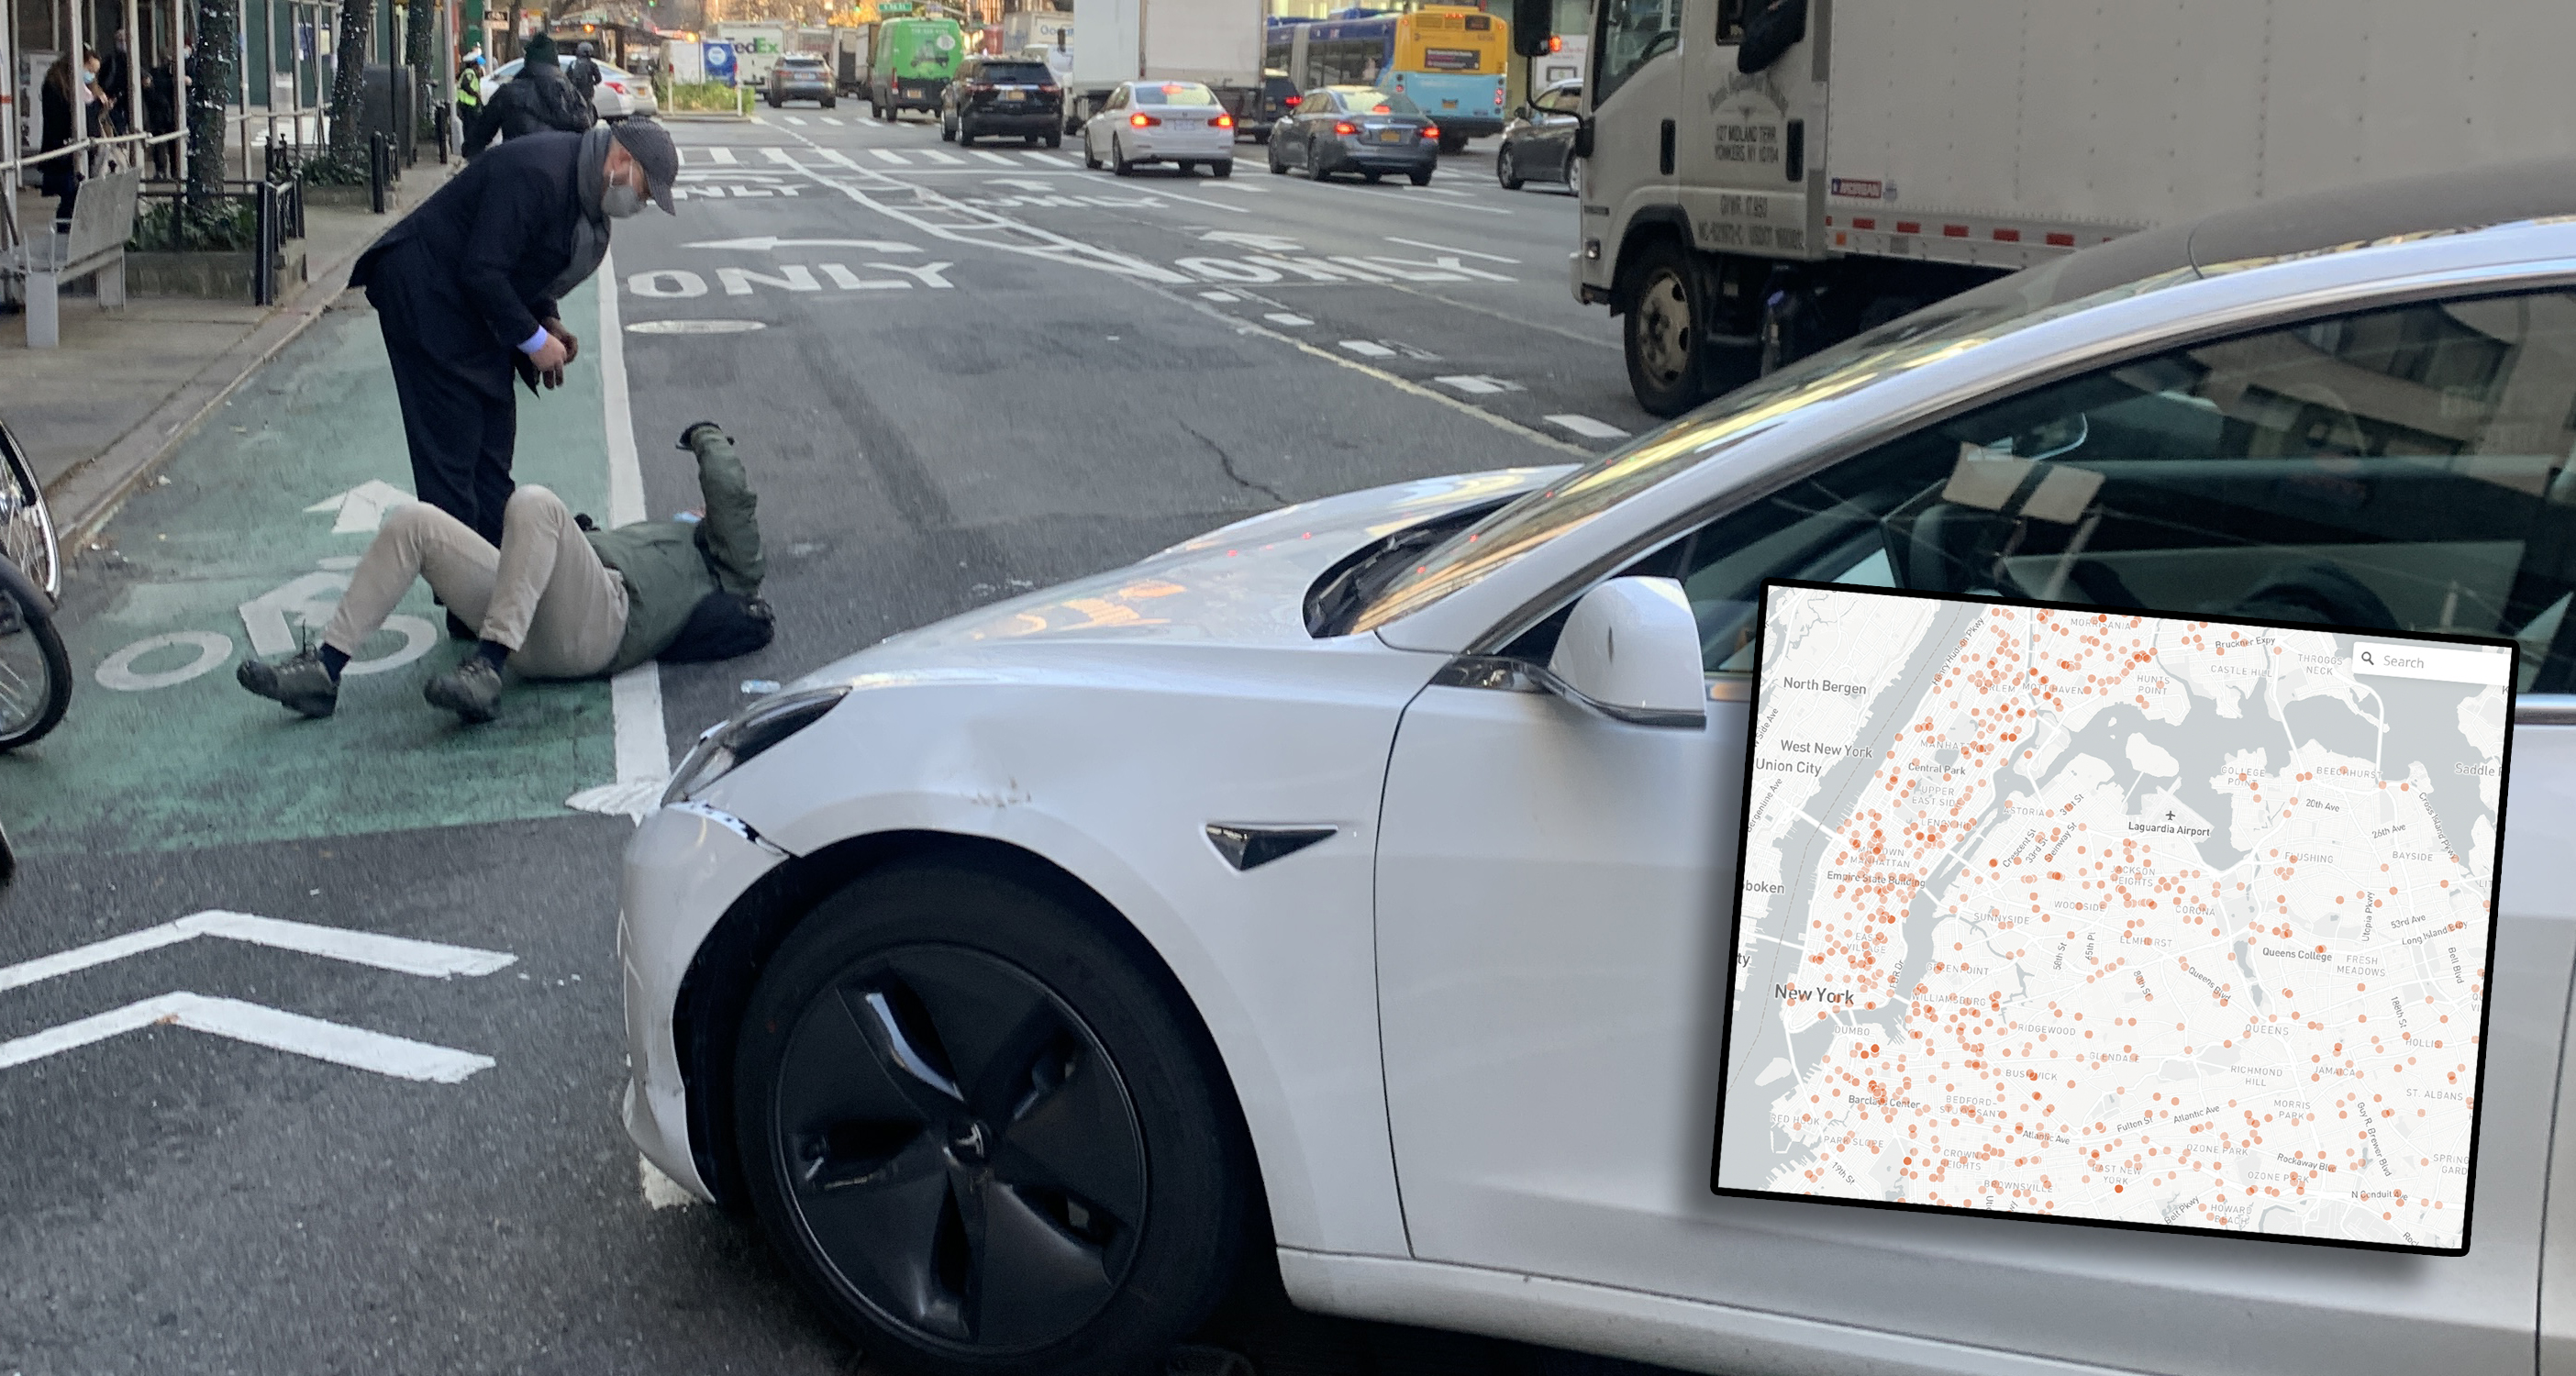
Serious injuries from traffic crashes are up 9.2 percent this past spring compared to last, according to city stats crunched by Transportation Alternatives, which launched its own online serious injury tracker on Monday.
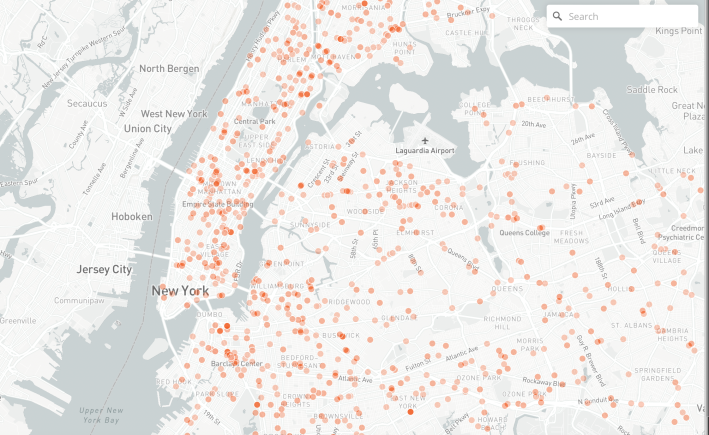
That new online injury tracker visualizes the 4,224 serious injuries that occurred between January, 2022 and June of this year, when the Department of Transportation was required by city law to begin publishing the stat — a city law sponsored by then-Council Member (and now-Transportation Commissioner) Ydanis Rodriguez.
That's roughly eight serious injuries every single day on average.
This year has continued that bloody trend: In the second quarter of the year — April, May and June — 784 people (468 motor vehicle occupants, 192 pedestrians and 124 cyclists) were severely injured in crashes. That's up from 718 (437 motorists, 172 pedestrians and 109 cyclists, respectively) during the second quarter of 2022.
That's an increase of close to 10 percent.
And there were 577 people seriously injured in the first quarter of 2023, also up 10 percent from the 526 serious injuries in the same quarter of 2022.
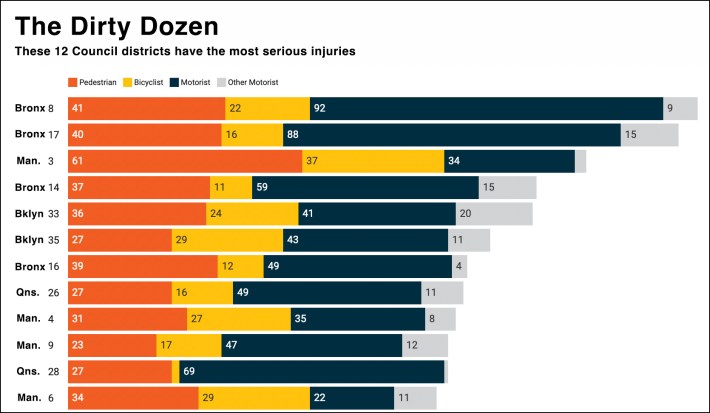
In the Vision Zero era, fatalities tend to garner the most attention, but serious injuries tell the larger story of the daily carnage on the streets of New York, where 11 people are severely injured for every person killed, according to the advocacy group's analysis. And serious-injury-causing crashes occur at a higher rate in the lower income parts of the city, 21 percent higher in the 10 poorest Council districts than for the city as a whole.
"This preventable public health crisis touches every neighborhood in New York City and requires bold action from City Hall,” said Philip Miatkowski, the group's senior policy and research director. "Serious injuries are the result of decades of failed and inequitable policy decisions that prioritize cars over people and leave behind our most vulnerable."

Among the group's revelations from the data:
- The number of serious injuries in the Bronx was 23 percent higher per capita than citywide.
- Total cyclist severe injuries were 77 percent higher per capita in Manhattan than citywide.
- Brooklyn had 27 percent more serious injuries per capita than the citywide rate.
State law defines a serious injury as a traffic crash injury "which results in death; dismemberment; significant disfigurement; a fracture; loss of a fetus; permanent loss of use of a body organ, member, function or system; permanent consequential limitation of use of a body organ or member; significant limitation of use of a body function or system; or a medically determined injury or impairment of a non-permanent nature which prevents the injured person from performing ... usual and customary daily activities for not less than 90 days."

A DOT rep insisted the agency has brought and is bringing safety redesigns to the lower-income parts of the city with higher severe injury rates — while noting that certain it is difficult to compare injury rates across council districts, such as those in Manhattan that fill up during the day with workers from other parts of the city and region.
“Throughout Vision Zero, DOT has worked to ensure all New Yorkers benefit from our safety projects — and we’ve seen the greatest decreases in pedestrian fatalities both in neighborhoods with high poverty rates and the highest levels of non-white residents," said the spokesman, Vin Barone.


