Report: New York Remains a Tale of Two Cities for Public Space Equity
See the city in a whole new light — an unflattering one.
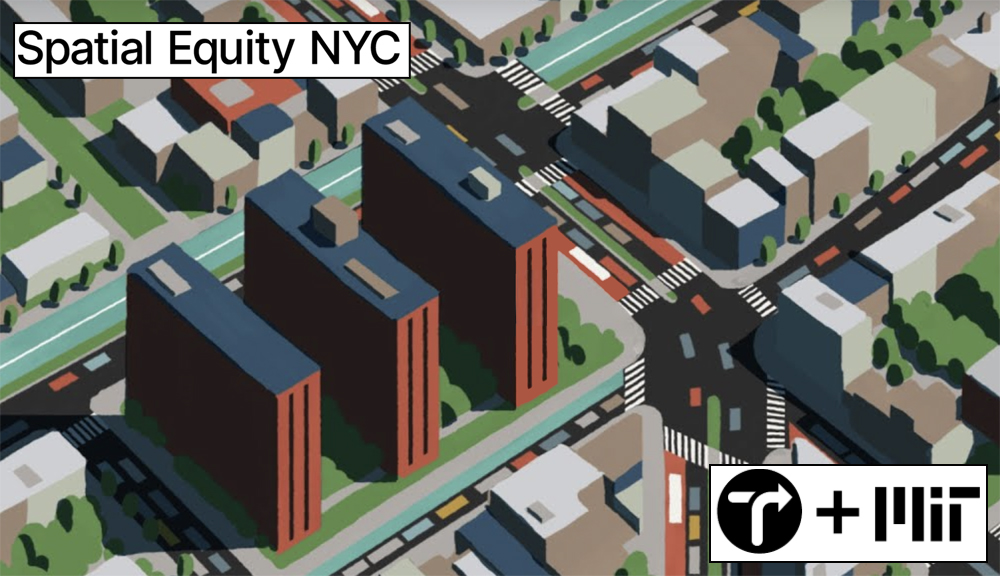
Today, Transportation Alternatives and the Norman B. Leventhal Center for Advanced Urbanism at the Massachusetts Institute of Technology are unveiling Spacial Equity NYC, a new tool that allows users, at the touch of a few buttons, to peer deeply into New York’s failures and analyze them across class, racial, geographic and demographic lines.
The resulting portrait reveals alarming inequities in how public space — including streets, sidewalks, and green spaces — is distributed in this city.
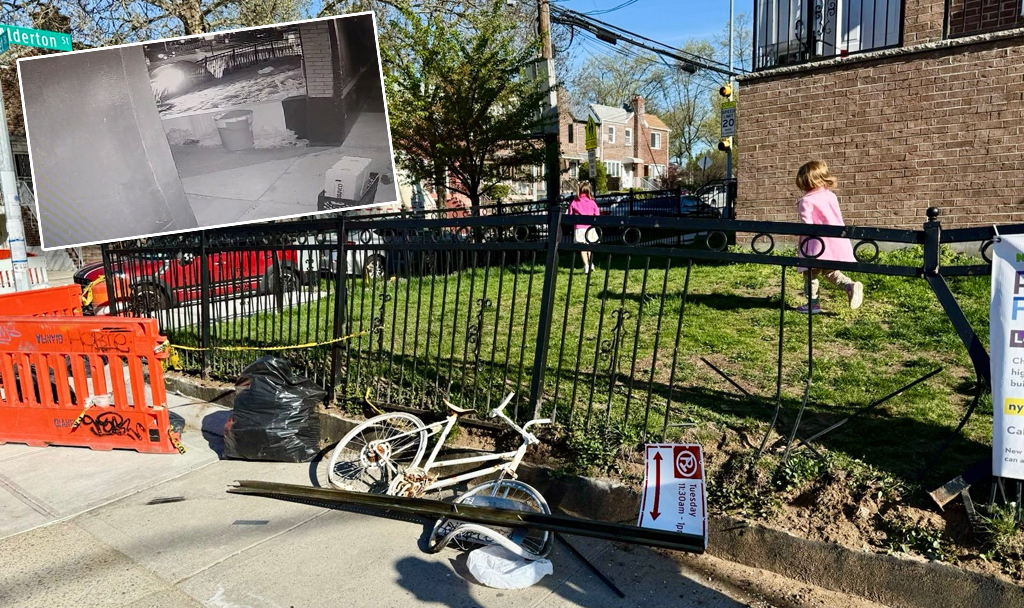
One of the starkest finding is the one that street safety advocates have been decrying for years: Poorer neighborhoods have more traffic injuries than richer ones:
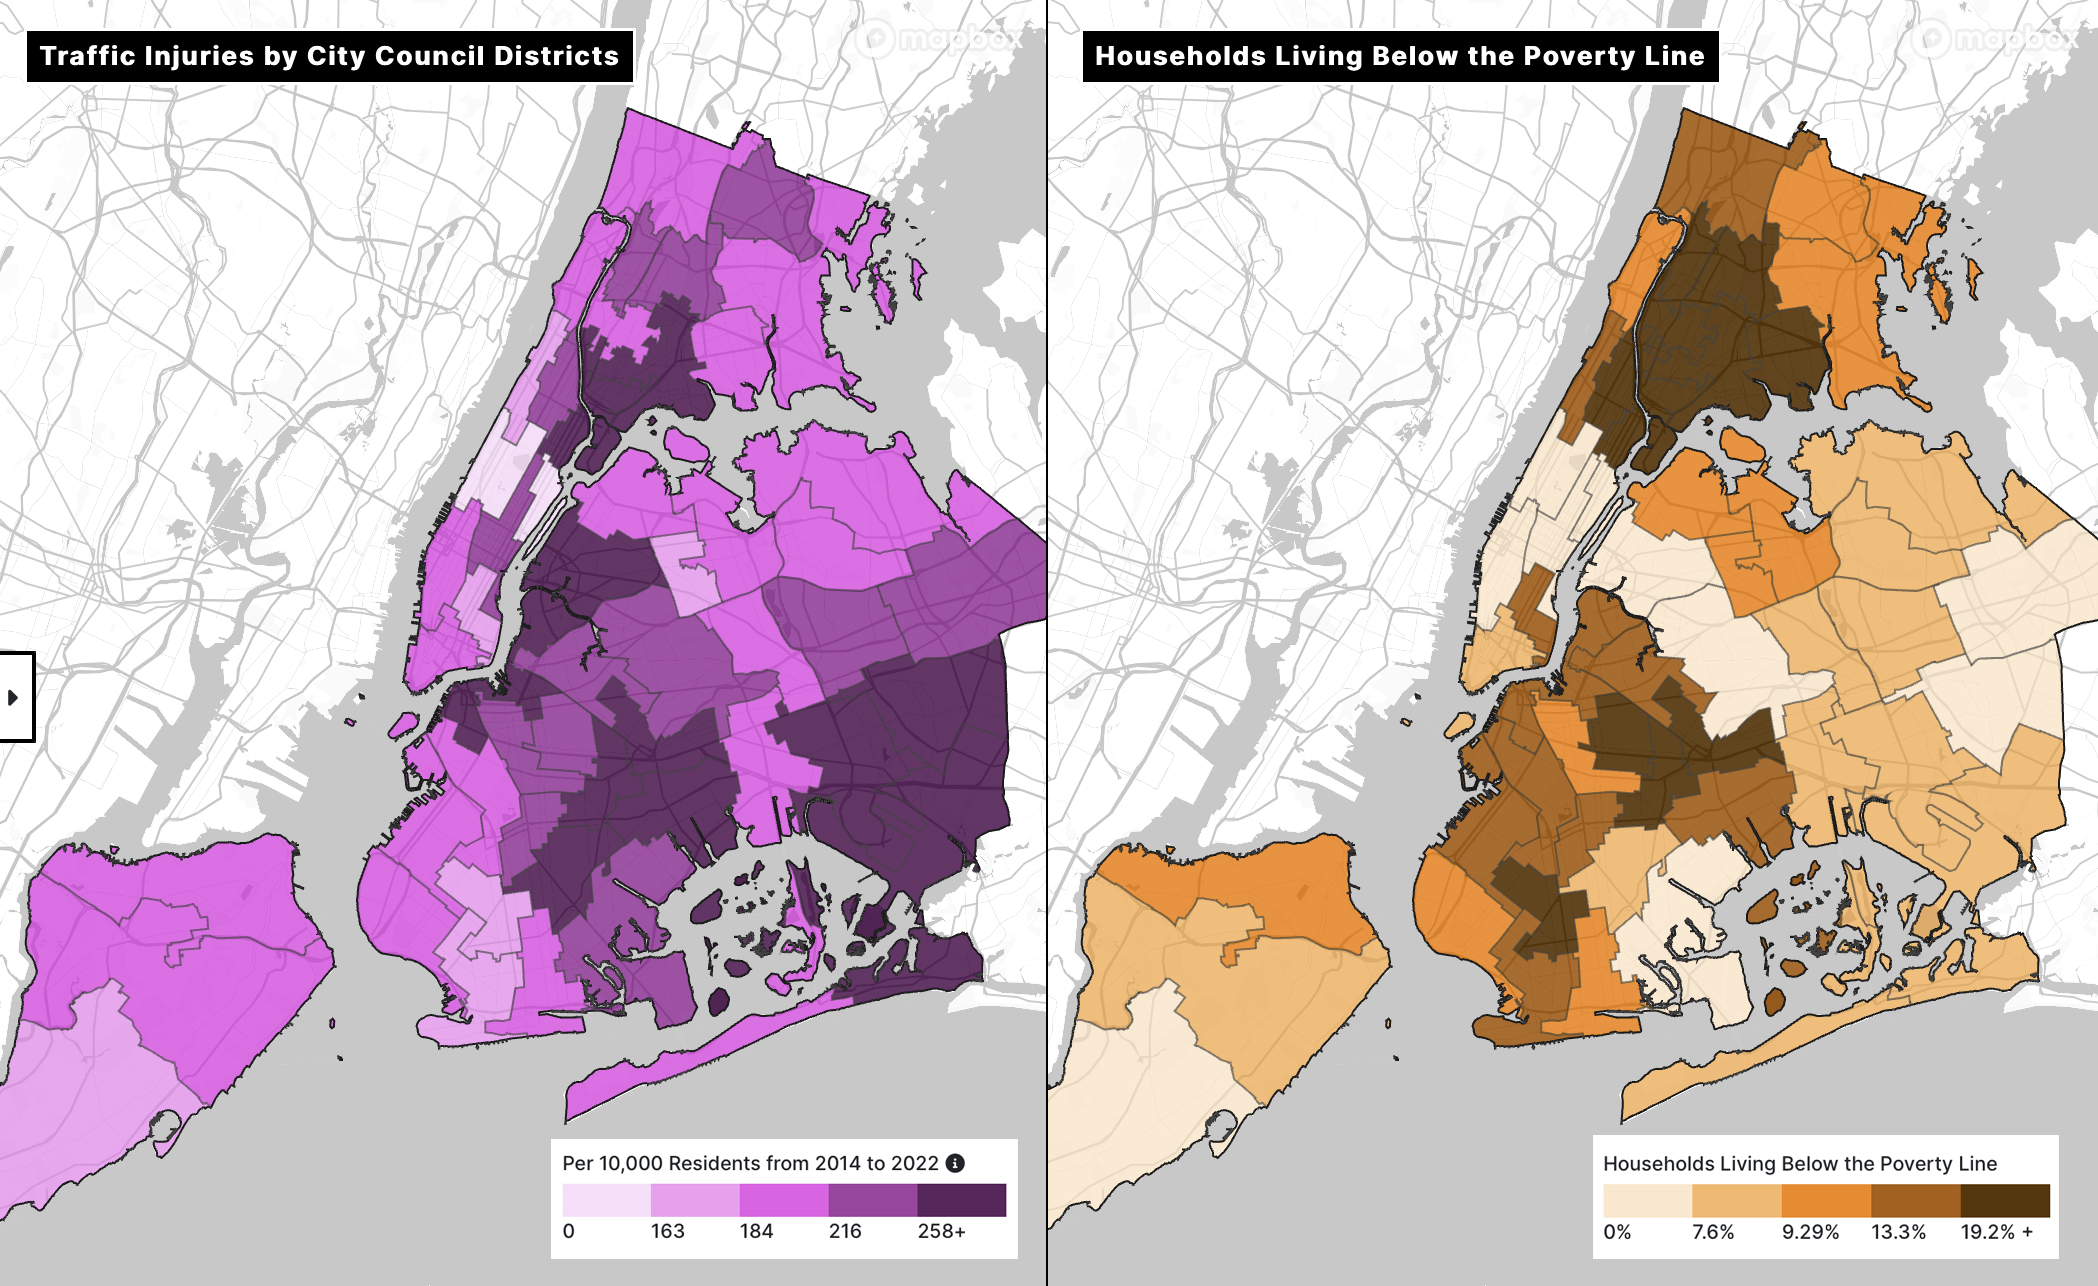
Other top-line findings are just as sad:
- In City Council districts where the majority of residents are Black, there are 68 percent fewer streets with a protected bike lane, 53 percent fewer bike parking spaces per capita, and a 39 percent higher rate of traffic injuries.
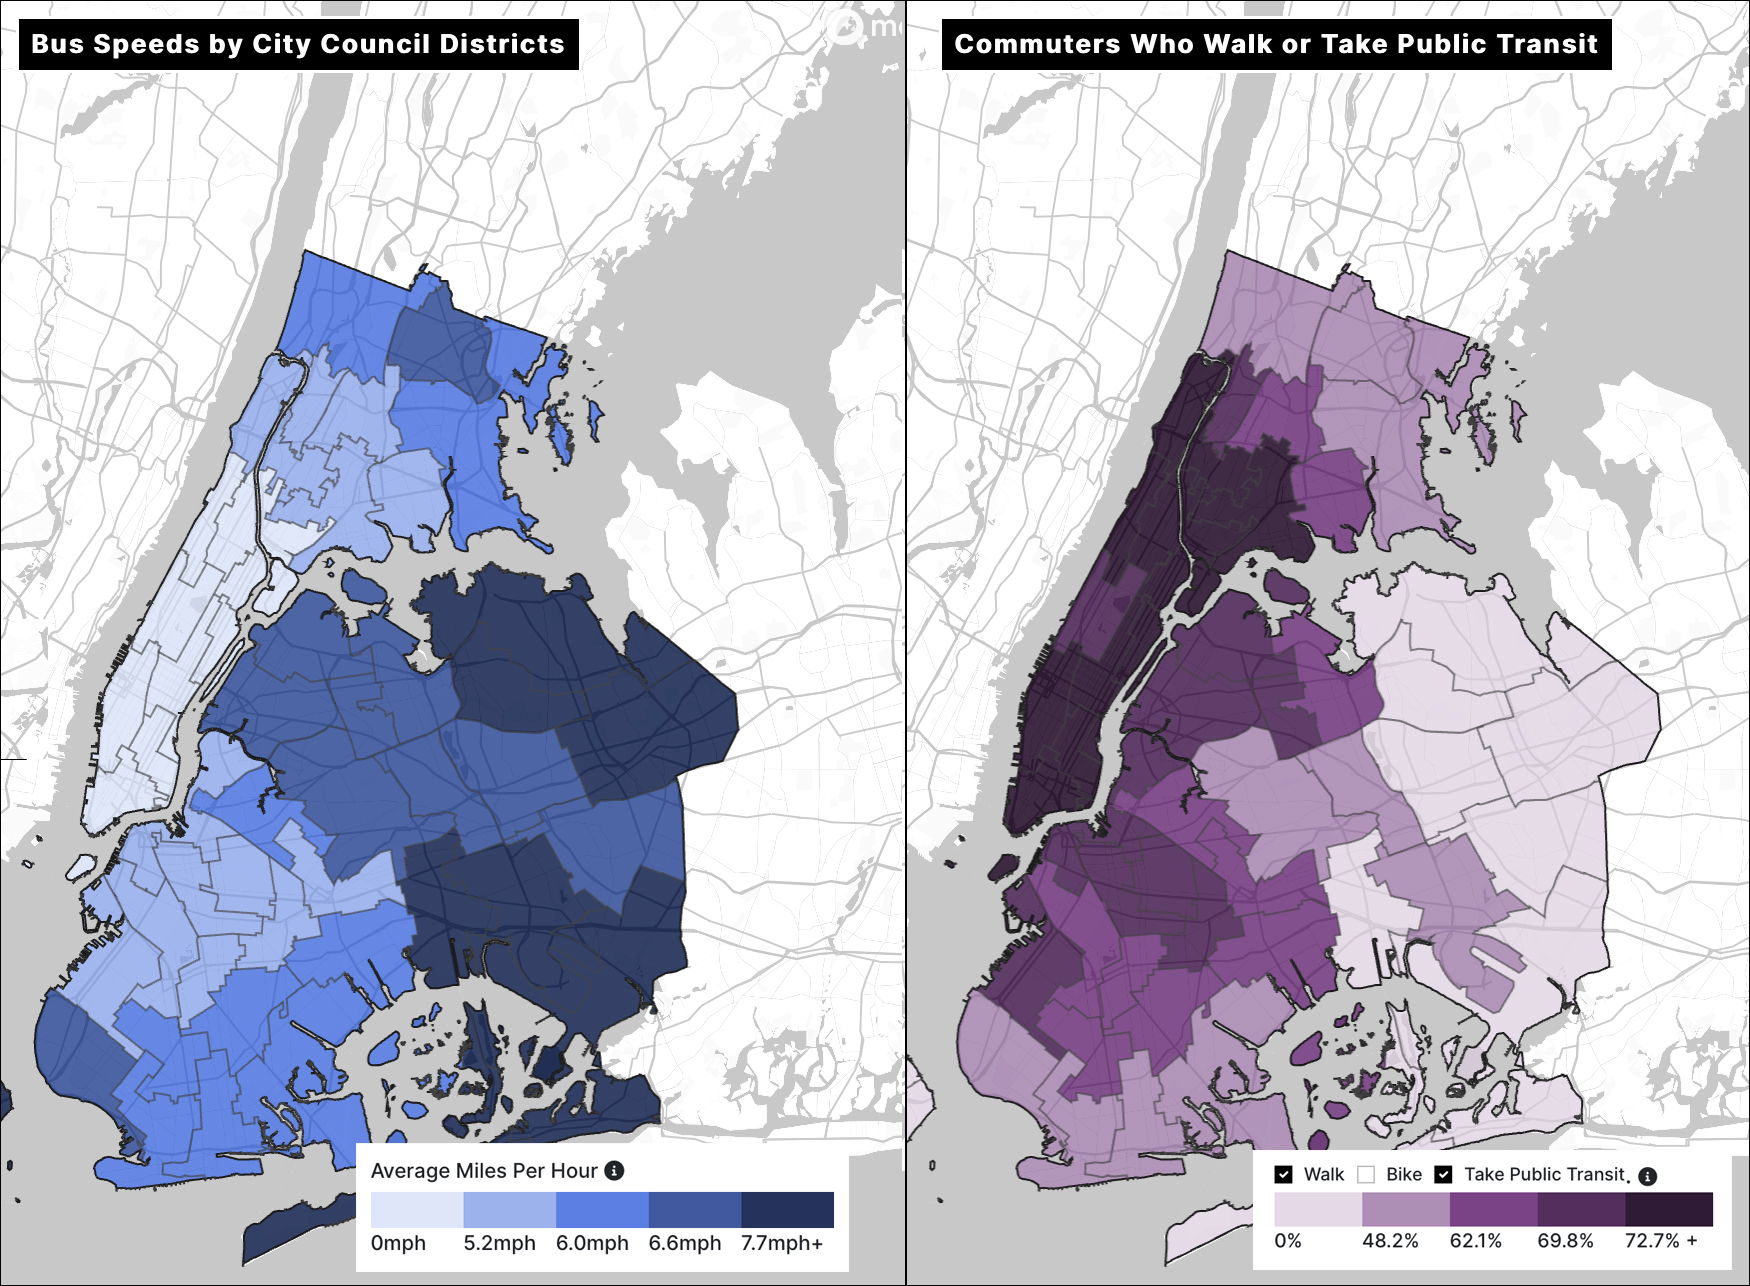
- In Council districts where the majority of residents are Latino, there are 17 percent fewer streets with a bus lane, traffic volumes are 11 percent higher, and buses are 10 percent slower, the slowest of any ethnic group.
- In the 10 Council districts with the highest number of residents who are people of color, there are 64 percent fewer streets with protected bike lanes, 49 percent fewer streets with bus lanes, and asthma rates are 51 percent higher.
- In the 10 Council districts with the largest Asian population, there are 14 percent fewer streets with protected bike lanes and 60 percent fewer streets with bus lanes.
- In a simple straight-up comparison between the the 10 Council districts with the largest populations of Whites vs. Blacks, the districts with the large Black population have asthma rates that are 96 percent higher, 83 percent fewer streets with protected bike lanes, 57 percent fewer streets with bus lanes, and traffic injury rates are 58 percent higher.
“Spatial inequity results in worse health outcomes, longer commutes, and higher rates of traffic violence — and the harm disproportionately impacts low-income communities and communities of color,” said Danny Harris, executive director of Transportation Alternatives. “With streets being New York City’s largest public space … transforming car space into space that prioritizes people would improve public health, mobility, and the environment across the five boroughs. Our public spaces should improve our lives, not harm them, and this new tool equips our elected leaders to finally do something about it.”
The Spatial Equity NYC database (and executive summary) allows users to quickly compare rates of asthma, noise pollution, traffic fatalities and injuries, air pollution, heat indices, access to open space, bus and bike lane mileage and traffic volumes among the 51 Council districts, but also with Census data to show which districts are discriminated against on the basis of race or ethnicity.
For example:
- the nine worst districts for asthma are all in Upper Manhattan or The Bronx. And in the worst 10 districts, 91 percent of residents are people of color. The population of the neighborhood with the lowest asthma rate in the entire city — the Upper West Side — is 72 percent White.
- In the 10 districts with the worst noise pollution levels, 75 percent of residents are people of color, compared to 67 percent citywide
- In the 10 districts with the most traffic injuries 87 percent of residents are people of color, compared to 67 percent citywide, and 51 percent of residents are Black, compared to 23 percent citywide. The area with the highest numbers of injuries due to road violence is District 42, represented by Council Member Charles Barron. It is also a district that ranks at close.
The tool is ideal if you want to understand single tragic topics at a time. Take air pollution, which is perverse considering patterns of car ownership in the city: the seven districts in the city that have the worst pollution (in the form of particulate matter) also correspond with the neighborhoods with the lowest levels of car ownership — meaning someone other than neighborhood residents are bringing in the pollution.
For example, District 3, which comprises Hells Kitchen and Chelsea and is represented by Erik Bottcher, has the worst pollution in the city — 30 percent higher than the citywide average and 41 percent more than District 46 in southern Brooklyn. But only 28 percent of the households in that pollution-choked Manhattan district have access to a car, while 70 percent of the households in the cleaner Brooklyn district do.
But don’t feel so great for residents of Mercedes Narcisse’s District 46: it has 18 percent more traffic injuries than the citywide average (and, in a related story, it has 223 percent fewer protected bike lanes than the citywide average), its surface temperature is .81 degrees hotter than the city average, and fewer of its residents have park access.
Such failures of leadership are all over the map — a map that gives advocates a new tool for change.
“Spacial Equity NYC makes all too clear [that] communities with less investment suffer the consequences: poorer physical and mental health outcomes, less livability, more dangerous streets,” said Jackson Chabot, director of Advocacy and Organizing at Open Plans (Streetsblog’s sister organization). “This tool should be an alarm bell and a blueprint; we urge our elected officials to immediately begin prioritizing investment in safe, joyful and well-managed public space for the most harmed communities.”
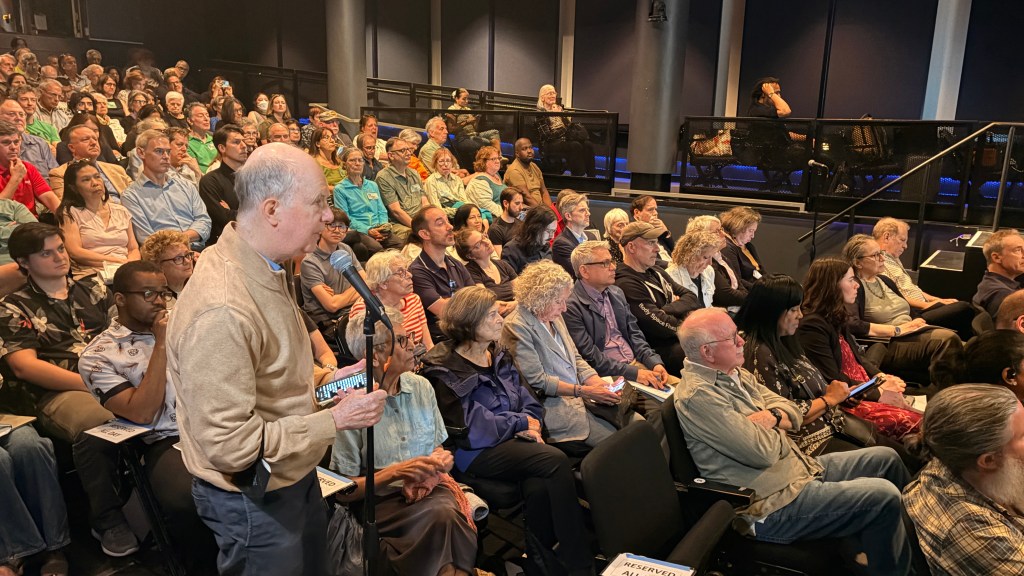
Public Advocate Jumaane Williams will join TA and MIT to officially launch the dataset with a press conference on the steps of City Hall at 10 a.m. on Tuesday.

Read More:

Streetsblog has migrated to a new comment system. New commenters can register directly in the comments section of any article. Returning commenters: your previous comments and display name have been preserved, but you'll need to reclaim your account by clicking "Forgot your password?" on the sign-in form, entering your email, and following the verification link to set a new password — this is required because passwords could not be carried over during the migration. For questions, contact tips@streetsblog.org.