CYCLE OF RAGE: City’s New Chart Doesn’t Help Us Visualize the Same Old Problem with Cars
Cars have dashboards to tell drivers what they need to know. Cities have dashboards that do the opposite.
Case in point: Comptroller Brad Lander has just created a "New York City Climate Dashboard" to assess how the Big Apple is improving its rotten-to-the-core environmental performance. The dashboard has categories such as "energy," "emissions" and "resiliency," and has subsections related to buildings, infrastructure and where the city is investing its money.
But one of the charts caught my eye:
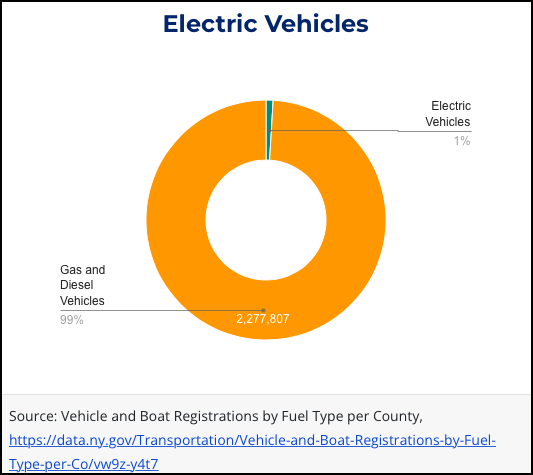
The chart is meant to show a baseline of current vehicle fleet attached to New York City households. There are 2,277,807 gas- or diesel-burning cars in the city and "only" 21,888 electric vehicles. (The total, 2,299,695 ignores the remaining 28,763 other vehicles registered to New York City residents, but let's not quibble. Yet.)
The problem with the chart above — like all pie charts — is that ignores the size of the pie in favor of emphasizing the data behind the slices. An equally accurate, but differently emphasized, chart would look like this:
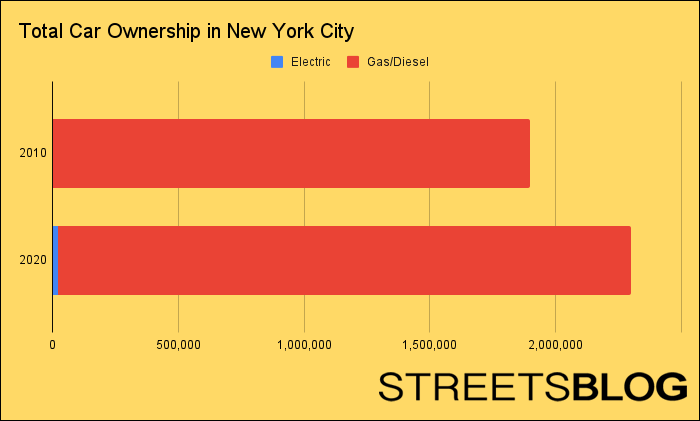
The chart above is based on Census data from the 2006-2010 American Community Survey plotted against the numbers in Lander's pie chart. Now do you want a piece of that pie?
So cheer all you want about the increasing segment of vehicles that are electric, but the number of total cars is on the rise, which means that the little line in blue is going to have to get much wider, much faster — but as long as the total line is getting longer, nothing will be solved regarding congestion, the ruination of our neighborhoods, and the increasing numbers of road deaths (in fact, electric cars tend to be far heavier than "regular" cars, causing more severe injuries in crashes).
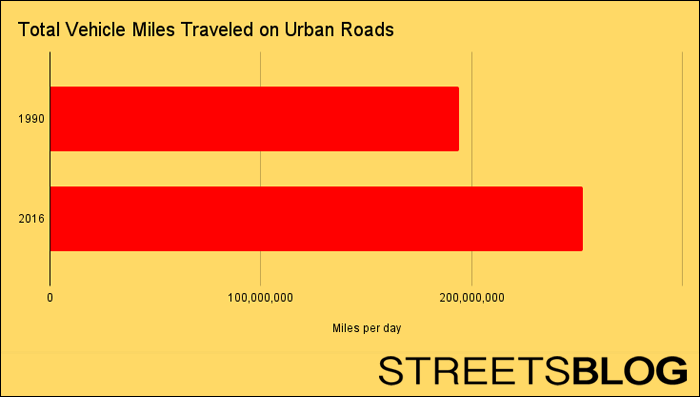
While we're on the subject of driving — and charts to show the deleterious effects — a state database reveals that total vehicle miles traveled in urban areas is also on the rise. In 1990, the daily VMTs on roads in "urbanized" areas of the state were 193,986,000. By 2016 (the last year for which data is offered), the total VMTs had risen to 252,895,000, or an increase of 30 percent.
Here's what that looks like in a chart:
Data scientists will likely approve of the way Streetsblog is graphically demonstrating the increase in cars.
"Pie charts [like the one from the Comptroller's office] don't show change over time effectively," Stanford University data scientist Kate Miller told Streetsblog. "The [electric car] pie chart can't show the reader the increase in cars overall, unless you had two pies of different shapes, but human beings are bad at eyeballing slight changes in pie wedge width. If you want to see the change over time, the best is a line or a bar graph."
Bottom line? The city needs to shrink the size of the pie — or make the lines in my charts trend quickly towards the left axis — if it has any chance of meeting its commitment to reduce greenhouse gas emissions 80 percent by 2050.
It's not in the stars. It's in the charts.
Gersh Kuntzman is the editor of Streetsblog. When he gets angry, he writes a Cycle of Rage column, all of which are archived here.
Stay in touch
Sign up for our free newsletter
More from Streetsblog New York City
Friday’s Headlines: Canal Street Follies Edition
Manhattan Borough President Mark Levine isn't happy. Plus other news.
Daylight Again: Bronx Community Board Backs Parking Ban at Intersections
The Boogie Down is down with daylighting!
Community Board Wants Protected Bike Lane on Empire Blvd.
Brooklyn Community Board 9 wants city to upgrade Empire Boulevard's frequently blocked bike lane, which serves as a gateway to Prospect Park.
The Brake: Why We Can’t End Violence on Transit With More Police
Are more cops the answer to violence against transit workers, or is it only driving societal tensions that make attacks more frequent?
Report: Road Violence Hits Record in First Quarter of 2024
Sixty people died in the first three months of the year, 50 percent more than the first quarter of 2018, which was the safest opening three months of any Vision Zero year.