Brooklyn Bridge Bike Lane Led Ongoing Boom Through 2021
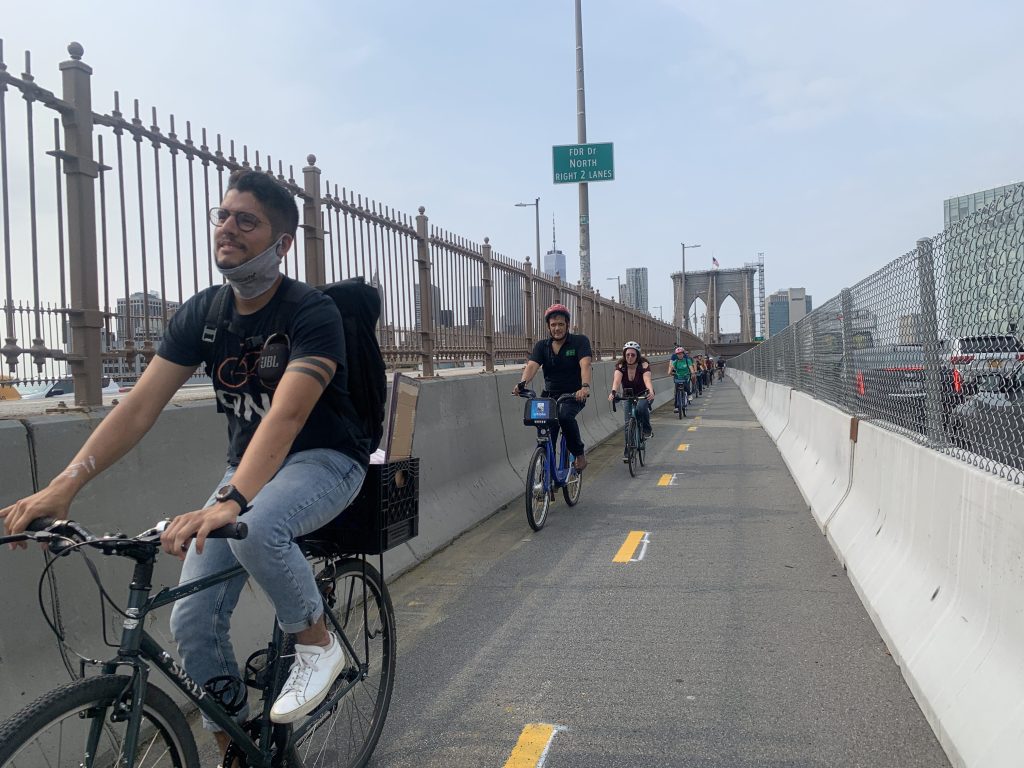
The new bike-only path on the fabled Brooklyn Bridge, which transformed a span that few cyclists used because of dangerously overcrowded conditions on a narrow shared walking and biking path, has led to an increase in the total number of cycling trips across all East River bridges — a reminder that creating safe bike infrastructure will not only raise the numbers using it, but also create new ridership.
Shortly after the Brooklyn Bridge bike lane opened last September, Streetsblog reported that the number of trips quickly rose 88 percent, compared to the same month the year before. And now, new data show the boom continued into the colder months.
The number of annual trips over the new eight-foot two-way bike path on the roadbed of the bridge’s Manhattan-bound side soared 27.2 percent from 550,594 in 2020 to 700,093 in 2021, according to data compiled by Bike New York.
“The new Brooklyn Bridge protected path clearly had a huge, immediate impact on bike ridership over the bridge,” said Katherine Willis, of Transportation Alternatives’s Bridges 4 People campaign.
The increase is part of the citywide bike boom that first took off during the height of the Covid-19 pandemic — a sign that the surge in cycling is here to stay, advocates say. The number of people pedaling over three of the four spans in 2021 — the Queensboro, Manhattan, and Brooklyn bridges — was higher than the year before, according to the data.
Trips over the Queensboro Bridge increased by 3 percent from 1,678,883 in 2020 to 1,729,894 in 2021; and on the Manhattan Bridge, they increased 7.1 percent from 1,506,301 in 2020 to 1,612,854 in 2021. Only on the Williamsburg Bridge did trips go down 2.1 percent from 2,094,024 in 2020 to 2,049,204 in 2021, the data show.
“That’s a pretty sustainable cold weather increase over 2020 and 2021,” said Jon Orcutt of Bike New York. “It’s clear that the vastly updated facility on the Brooklyn Bridge is attracting new bike trips.”
But the overall year-to-year increase is especially notable given that the volume was stagnant, if not trending down, across the city bridges until the pandemic kicked off the fabled 2020 bike boom.
Cycling over the Williamsburg Bridge, for example, peaked in 2015, when New Yorkers took 219,451 bike trips that May, according to city data. That number decreased to 173,671 by May, 2016, and hovered around there until May, 2019, when there were 170,982 bike trips logged.
But the number of people riding across the bridge between Williamsburg and Manhattan started increasing again in May 2020, when 186,791 trips were taken, the data shows. In May 2021, New Yorkers took 216,487 trips across the bridge.
“The bike boom lives,” said Orcutt.

Read More:
Streetsblog has migrated to a new comment system. New commenters can register directly in the comments section of any article. Returning commenters: your previous comments and display name have been preserved, but you'll need to reclaim your account by clicking "Forgot your password?" on the sign-in form, entering your email, and following the verification link to set a new password — this is required because passwords could not be carried over during the migration. For questions, contact tips@streetsblog.org.