If you want to know whether MTA bus speeds are improving -- or not -- there's now an easy way to check. The agency went live yesterday with a new bus performance dashboard.
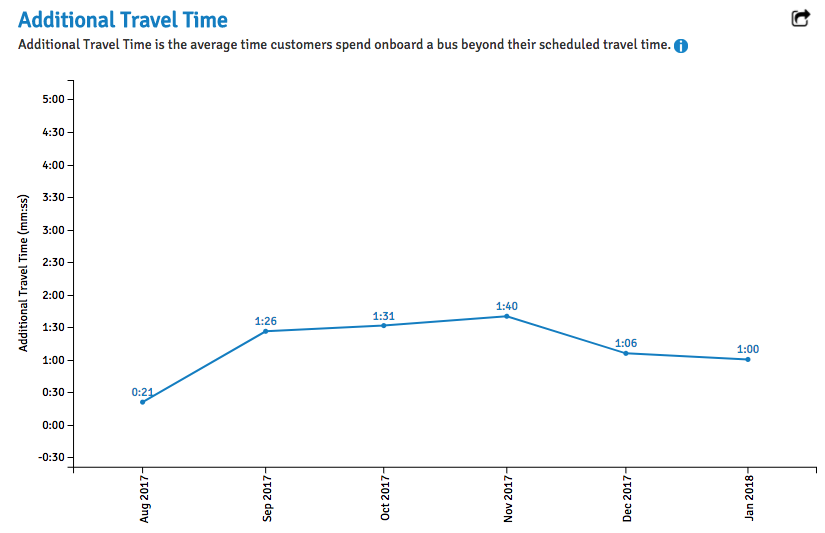
In addition to bus speeds, the MTA included two other metrics that advocates were especially encouraged to see: "additional bus stop time" and "additional travel time." These measure the extra time riders spend waiting at bus stops and on the bus, respectively, compared to the schedule. The MTA publishes the equivalent metrics in its recently-launched subway performance dashboard as well.
“It’s really great to see the MTA continuing to reaffirm its commitment to using performance metrics that actually reflect customer experience," said Zak Accuardi of TransitCenter, which has pushed the agency to publish metrics that riders can grasp intuitively.
The dashboard allows you to chart changes in these metrics over time, and to break down performance by borough and peak/off-peak service.
Data for some metrics, including the rider-centric measures of delay, only goes back to August 2017. And unlike the bus report cards advocates publish, the MTA's dashboard does not make information available for individual routes.
“There are almost 250 local routes in the system, so it’s just not a detailed enough view to identify which routes are doing the best and which are in need of more help," Accuardi said.
MTA Chief of Operations Planning Peter Cafiero unveiled the dashboard at yesterday's MTA board meeting, saying it's a precursor to the agency's forthcoming "bus action plan."
“We’re really looking for this to inform our bus plan, and where to target improvements, and then to track how well we’ve been doing that," he said.
Accuardi said the timing is encouraging. "We’re hopeful these data provide a strong foundation for the plan, and that New York City Transit seizes on the momentum generated by this performance dashboard.”
Not all of the metrics on the dashboard are helpful, however. "Service delivered," which measures the percentage of buses that complete their scheduled runs, and "customer journey time performance," which measures the share of riders whose trips take no more than five minutes longer than scheduled are based on "arbitrary thresholds," said Accuardi, and don't necessarily reflect the quality of service that riders experience.
Because these metrics are not tethered to the specific amount of time that riders lose to delay, they are more susceptible to manipulation. In the past, for instance, the MTA has responded to slower bus speeds by adjusting schedules, so the share of service delivered as scheduled could stay steady over time even as service declines.
Pressed by board members yesterday whether the agency would simply adjust schedules to improve those numbers, MTA New York City Transit President Andy Byford said the MTA is committed to "route-by-route" analysis to reduce delays.
"[We] should also be relentlessly looking into, okay, so what is it then that's impeding that bus from sticking to schedule, rather than just giving up and adding some time to it," Byford said.