Schaller: Curbing Uber “Idle Time” Key to Busting Manhattan Gridlock
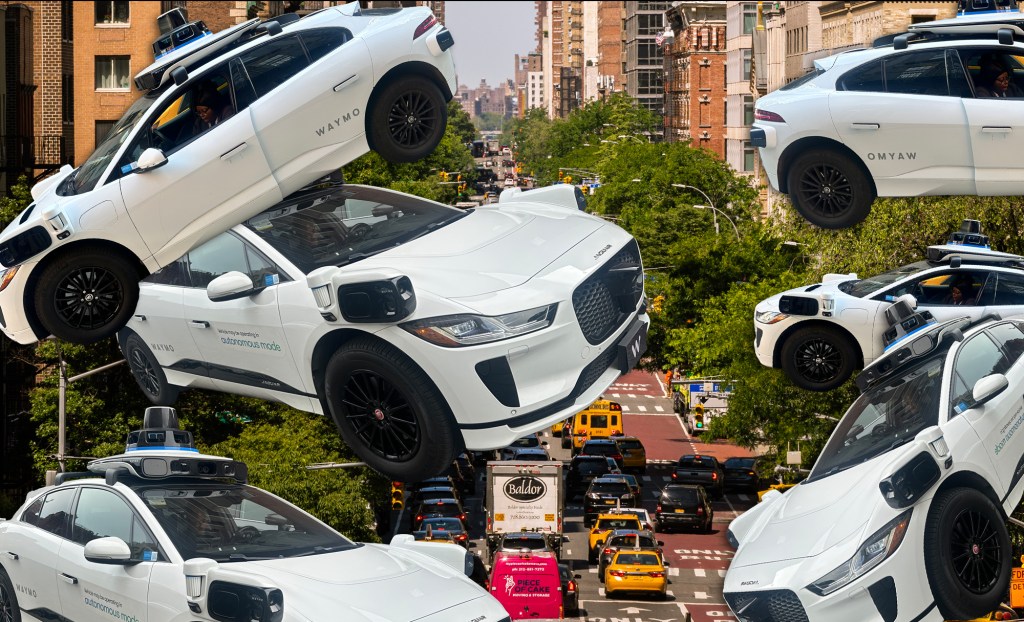
A report published today by taxi savant Bruce Schaller pins Manhattan’s current traffic meltdown squarely on the relentless growth in Uber, Lyft, and other app-based for-hire vehicles.
Schaller’s key finding is that for-hire vehicles in the Manhattan core are traveling greater distances and in greater numbers — and that a rising amount of this traffic occurs without a passenger in the vehicle. He proposes regulatory incentives aimed at modifying the companies’ algorithms that match drivers to customers, a step he says could markedly cut Manhattan traffic without resorting to surcharges or other traffic pricing to dampen demand.
“Empty Seats, Full Streets: Fixing Manhattan’s Traffic Problem” [PDF] breaks ground by analyzing publicly available records of drop-off and pickup locations for services like Uber known as transportation network companies, or TNCs. It expands on the findings of Schaller’s February report, “Unsustainable? — The Growth of App-Based Ride Services and Traffic, Travel and the Future of New York City.”
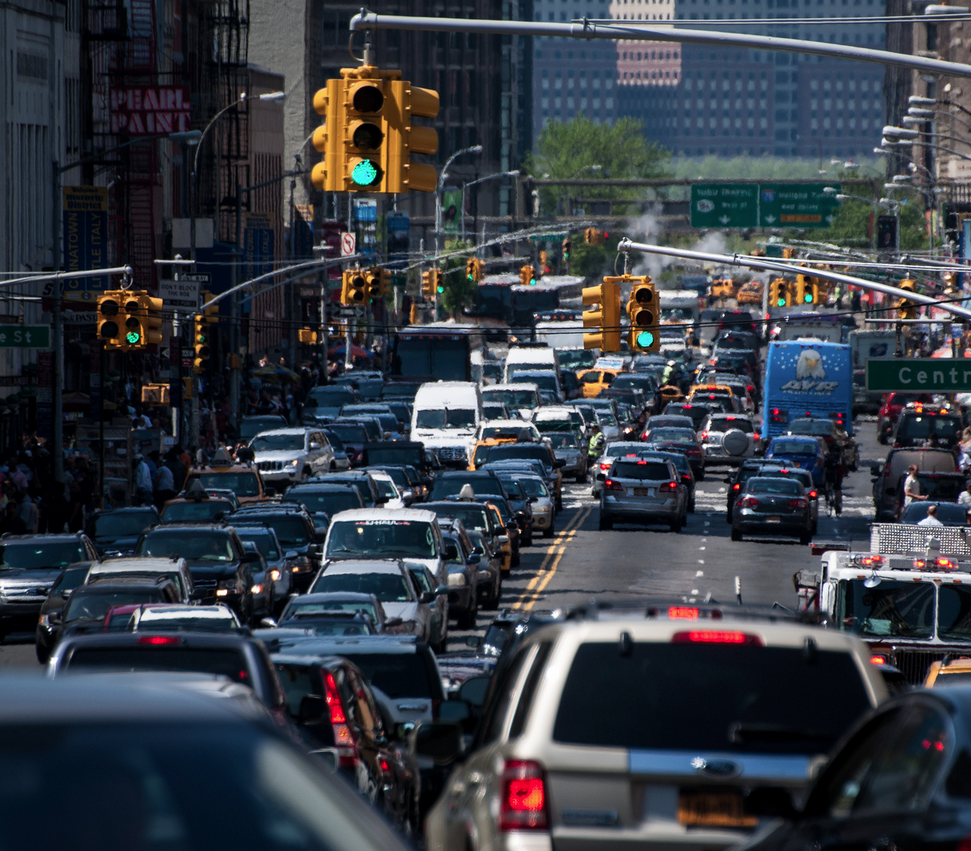
Data from the nearly half a million daily TNC fare trips in the five boroughs enabled Schaller to zero in on the 8.5-square mile Manhattan central business district, where worsening gridlock is expected to be the focus of a congestion pricing plan to be unveiled by Governor Cuomo in his January 3 “state of the state” address.
Schaller calculated growth trends in what he calls “the combined taxi/TNC sector” since 2013, the last year before Uber burst on the scene. He found:
- On an average weekday, 15 percent more taxi/TNC trips beginning and/or ending in the CBD were made in June 2017 than June 2013.
- Combined taxi/TNC weekday mileage in the CBD grew by 36 percent, as mileage rose faster than trips due to both greater trip lengths and increased cruising — the percentage of mileage with no passengers.
- The number of taxi/TNC vehicles in the CBD increased more, by 59 percent, due to slower traffic speeds.
- Because of increased cruising, the number of unoccupied taxi/TNC vehicles increased by 81 percent.
Taxis and TNCs together now account for 1.5 million miles of weekday mileage in the Manhattan core, according to Schaller, with taxis at just under 700,000 miles (a one-third decline in just four years) and TNCs just over 800,000. The combined figure gives for-hire vehicle 45 percent of all motor vehicle mileage in the central business district.
Schaller puts the net rise in for-hire vehicle traffic in the CBD since 2013 at 378,000 miles per day. This increase is more than four times as great as the drop in mileage from declining automobile commuting into the CBD over the same period, by my calculations. It also amounts to 10-12 percent of current total mileage in the central business district, suggesting that growth in for-hire vehicle travel is the biggest cause by far of deteriorating travel speeds.
To break or at least bend the link, Schaller suggests targeting “unoccupied time” — the minutes between a driver’s dropping off the last passenger and being dispatched to pick up the next:
The City or State could require that TNC companies reduce excessive unoccupied time by the vehicles dispatched by them. “Excessive” could be defined as the time greater than needed for driving to the pick-up location … [and could] be subject to a penalty (most likely financial). The objective of the penalty would be to strongly incentivize TNC companies to minimize the unoccupied time of their drivers.
While Schaller would leave it to the companies to work out the mechanics, he cites a program called “rematch” that Uber and Lyft are employing at JFK and LaGuardia and other airports around the country. The companies’ dispatch systems, he says, “offer trips to drivers at airport terminals just as they drop off an arriving passenger,” which avoids drivers dead-heading to the waiting area several miles away while another driver of an unoccupied vehicle must go from the waiting area to the terminal.
It’s not clear how rematch could work in Midtown’s chaotic street environment. Schaller appears to be counting on regulatory incentives spurring Uber, Lyft, and their competitors to devise the necessary algorithms. He also concedes that taxis, which operate primarily through street hails, would require a different mechanism, perhaps allocating each cab a set number of hours in which it could operate in the CBD.
Taxis are less central to congestion in the Manhattan core, however, due to both their shrinking market share and the lesser amount of unoccupied time compared to TNCs. Nevertheless, Schaller estimates that “eliminating unnecessary occupied time between trips” by all for-hire vehicles could reduce total central business district traffic by 7 to 11 percent.
He is less sanguine on the potential to cut congestion via for-hire vehicle surcharges, arguing that the low price-elasticity of taxi and TNC trips consigns surcharges to be revenue-raisers that would barely make a dent in traffic. It’s possible he is understating the price sensitivity of some for-hire trips as well as overlooking surcharge options pegged to each trip’s mileage and minutes within the CBD, rather than being set as a single, flat fee.
Nevertheless, the new Schaller report makes a major contribution to understanding how Uber and other app-based ride services have exacerbated Manhattan traffic congestion. With Uber and Lyft continuing to increase relentlessly — I estimate that in the first three quarters of the year their daily trip volumes in the five boroughs rose each week by an average of 1,250 and 1,000, respectively — his analysis and recommendations merit wide attention.

Read More:
Streetsblog has migrated to a new comment system. New commenters can register directly in the comments section of any article. Returning commenters: your previous comments and display name have been preserved, but you'll need to reclaim your account by clicking "Forgot your password?" on the sign-in form, entering your email, and following the verification link to set a new password — this is required because passwords could not be carried over during the migration. For questions, contact tips@streetsblog.org.