Biking in New York City has been rising at a steady clip, according to a new report from NYC DOT, increasing about 50 percent between 2010 and 2014 -- maybe more, depending on the metric you look at. What's not so clear is how things changed in 2015, because the report lacks key information about bike traffic on the Hudson River Greenway.
The new report, "Cycling in the City" [PDF], combines data from three main sources: the U.S. Census, a city Department of Health survey, and DOT's bike counts on Midtown avenues and the East River bridges (it also includes some Citi Bike numbers).
Overall, the surveys and bike counts show an unambiguous upward trend in cycling, affirming the impact of recent investments in bike infrastructure. The report also shows where bicycling growth is lagging, perhaps as a result of slower bike network expansion compared to the rest of the city.
In some ways the report is a step up from the annual cycling metrics DOT has released in the past, which only included the DOT bike counts. Folding in the Census bike commute numbers and health department survey data yields a more complete view of citywide and borough-by-borough cycling trends.
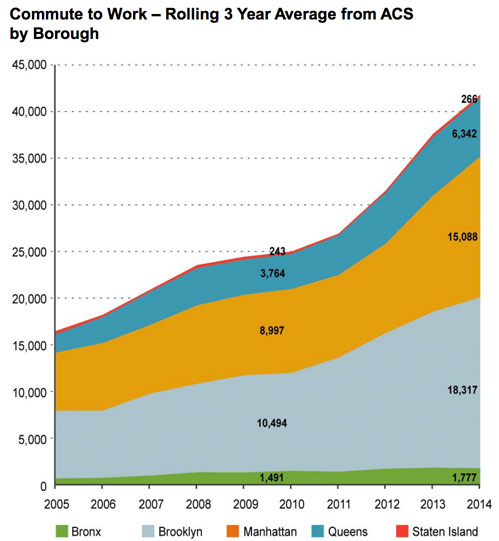
According to the Census, bike commuting has grown the fastest in Brooklyn, rising 75 percent from 2010 to 2014. Close behind are Manhattan and Queens at 68 percent. Then it's a steep drop to the Bronx, at 19 percent growth, and Staten Island at 9 percent.
DOT's bike program has a substantial slate of projects on tap for this year -- including protected lanes in every borough except Staten Island -- but more can be done. "Cycling rates continue to rise across the five boroughs, even as the bike lane network remains spotty," said Transportation Alternative Executive Director Paul Steely White. "To meet this challenge, New York City needs equitable acceleration and expansion of the bike network in the Bronx and Staten Island, as well."
As welcome as it is to have a fresh report on cycling trends in New York, there are some perplexing omissions. Namely, it's impossible to compare DOT's 2015 bike counts to previous years, because unlike previous reports, this one doesn't include counts of cyclists on the Hudson River Greenway and 50th Street, or at the Whitehall ferry terminal.
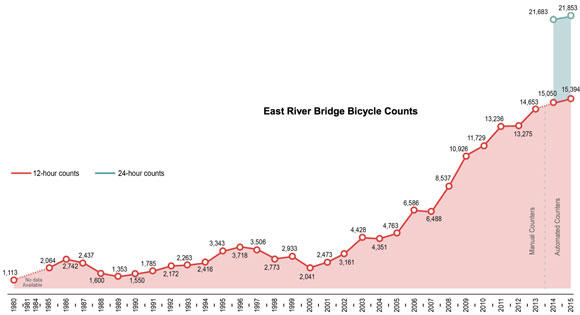
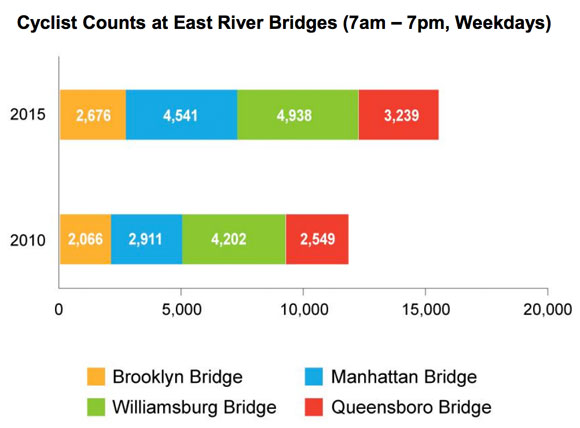
The new report does break down the bike traffic on each East River bridge, but in another departure from previous practice, you can't easily see how the new bridge counts fit into a year-over-year trendline. Bike counts from past years are buried in old reports that are tough to locate on DOT's website.
Instead of waiting for DOT to release a report with all of these stats each year, the city should be publishing them as feeds on its open data portal, giving New Yorkers access to all the underlying numbers.
Another disappointment is the lack of hard bike counts from new locations farther from the city center. The geographic limitations of DOT's published bike counts, which only track bike activity across the boundaries of the Manhattan CBD, have been acknowledged as problematic for a long time. DOT has not responded to an inquiry about whether it will expand the scope of its bike counts and post its cycling stats as open data.
If you've made it through the previous 500 words, congrats. This is the part where I embed some of the interesting visuals from the report.
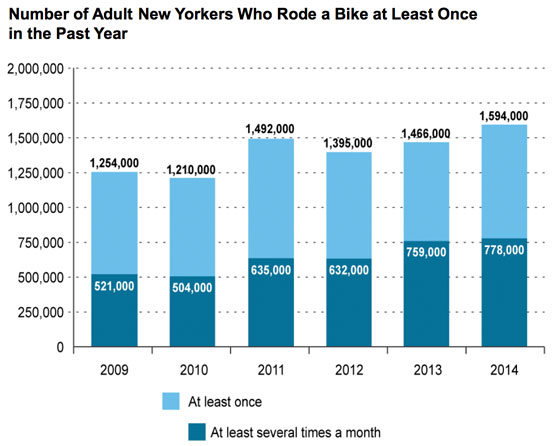
These numbers come from an annual Department of Health survey of about 8,500 New Yorkers. Unlike the Census, the survey isn't limited to questions about commute trips. It captures a broader but vaguer spectrum of bike activity, and the numbers are much bigger. The most impressive growth is in the dark blue bars -- the number of people who bike several times a month increased about 50 percent in a few years.
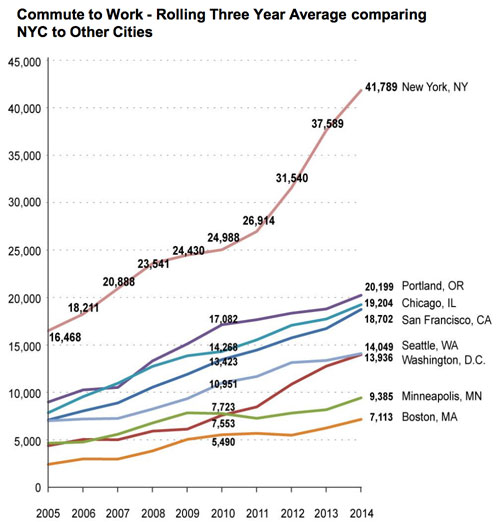
The number of people who bike to work in New York rose at an especially fast clip the past few years. While the share of New York workers who bike commute (between 1 and 2 percent) still lags behind cities like Portland, Minneapolis, and DC (4-7 percent), NYC has done some catching up.
According to travel survey data, about 20 percent of trips in the NYC region are commute trips. Assuming that the city's 40,000 or so bike commuters each bicycle to work and back, NYC DOT extrapolates from that 1-in-5 ratio to estimate that there are about 400,000 bike trips in the city on a typical day.
These two graphics, above and below, are how NYC DOT presented its East River bridge bike counts, which include some of the only 2015 data in the new report. The recent trend is upward but seems to be plateauing after a few years of more rapid growth.
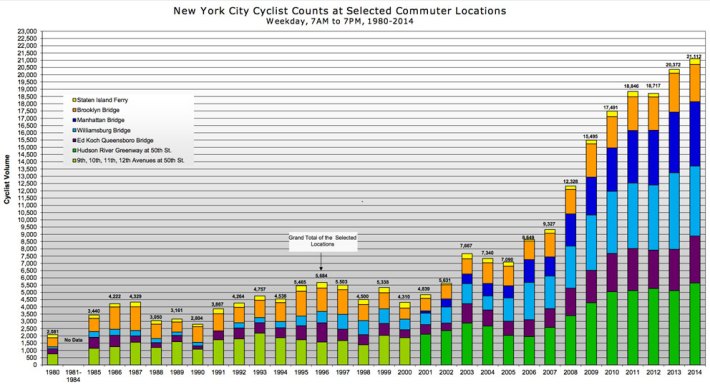
The bridge-only counts are a departure from the "screen line" count that DOT has released in previous years, which also included cyclists crossing the Hudson River Greenway at 50th Street. In the new report, the greenway bike counts are instead lumped into a chart of bike traffic on Midtown avenues, and you can't see the actual greenway number.
Since the greenway count isn't shown in the new report, we can't make a direct comparison to the screen line data from 2014 and prior years. Here's how DOT visualized the screen line data last year -- note the bars denoting the different components of the count:
This is why the bike count numbers and the other data in this report should be published through the city's open data portal. While DOT can add value by packaging stats in reports for a mass audience, it shouldn't be up to the agency to decide which data to publicly release. There are hundreds of datasets in the portal already, and bike counts should be no exception.
