The Science (and Maps) Behind Finding Available Citi Bikes and Docks

Coming across an empty bike-share station when you need a bike -- or a full one, when you need a dock -- is a disappointing experience, to say the least. While Citi Bike's rebalancing efforts try to keep up by shuttling bikes around town, the company is working against a tide that shifts demand unevenly across its service area.
Juan Francisco Saldarriaga, a researcher at Columbia University's Spatial Information Design Lab, mapped those demand imbalances as part of a project the lab is working on. "Origins and destinations of Citi Bike trips are not necessarily symmetrical during the day," he wrote. To untangle the patterns of bike-share riders, the team used weekday data from last October to create a matrix showing imbalances at every station by hour of day.
There are predictable patterns: Between 10 a.m. and midnight, stations around Union Square act as the center of much of the system's activity. Not surprisingly, Penn Station and Grand Central become hotspots during peak hours. The worst imbalances occur from 6 to 10 a.m. and again from 4 to 8 p.m., though there a handful of outlier stations that either don't experience major imbalances or see capacity problems outside those hours.
Imbalances at busier stations affect more people than imbalances at out-of-the-way stations, so the group isolated the highest-impact problem spots by creating a chart that overlays the severity of imbalances with total activity at each station by hour.
Finally, there are some stations that are surrounded by a sea of imbalanced stations, but seem to experience relatively few problems of their own. For one reason or another, something is going right at these locations. "These stations have been outlined on the maps and should be further studied," Saldarriaga wrote.
There are more maps, as well as charts and animated GIFs to see how bikes move across the Citi Bike network, at the Spatial Information Design Lab website. The data could be used to produce more than just neat maps and animations: Citi Bike is a participant in this year's Big Apps challenge, an effort led by EDC to use open data to create useful tools for New Yorkers. Now, if only there were an app to fix those broken docks.
Stay in touch
Sign up for our free newsletter
More from Streetsblog New York City
Friday’s Headlines: Canal Street Follies Edition
Manhattan Borough President Mark Levine isn't happy. Plus other news.
Daylight Again: Bronx Community Board Backs Parking Ban at Intersections
The Boogie Down is down with daylighting!
Community Board Wants Protected Bike Lane on Empire Blvd.
Brooklyn Community Board 9 wants city to upgrade Empire Boulevard's frequently blocked bike lane, which serves as a gateway to Prospect Park.
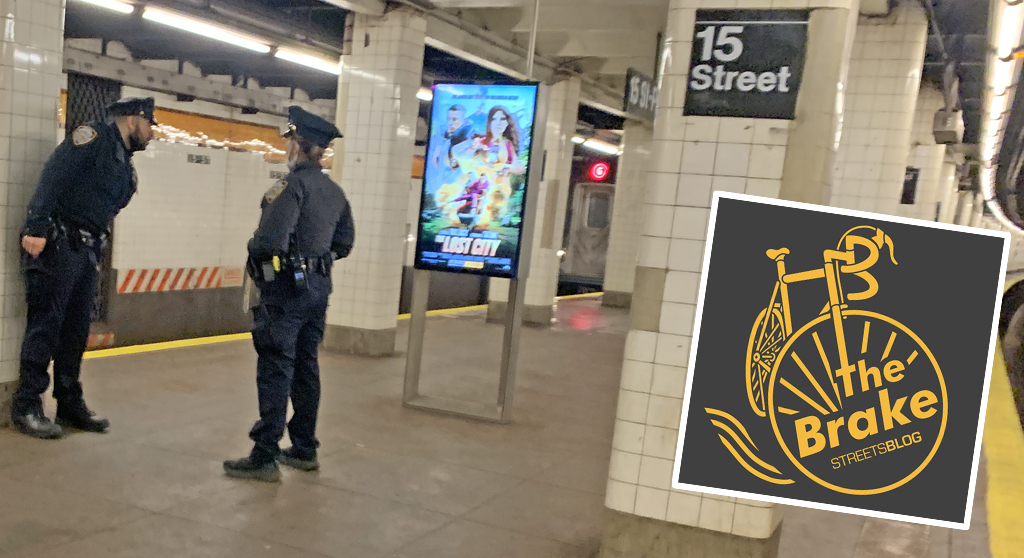
The Brake: Why We Can’t End Violence on Transit With More Police
Are more cops the answer to violence against transit workers, or is it only driving societal tensions that make attacks more frequent?
Report: Road Violence Hits Record in First Quarter of 2024
Sixty people died in the first three months of the year, 50 percent more than the first quarter of 2018, which was the safest opening three months of any Vision Zero year.