The Science (and Maps) Behind Finding Available Citi Bikes and Docks

Coming across an empty bike-share station when you need a bike -- or a full one, when you need a dock -- is a disappointing experience, to say the least. While Citi Bike's rebalancing efforts try to keep up by shuttling bikes around town, the company is working against a tide that shifts demand unevenly across its service area.
Juan Francisco Saldarriaga, a researcher at Columbia University's Spatial Information Design Lab, mapped those demand imbalances as part of a project the lab is working on. "Origins and destinations of Citi Bike trips are not necessarily symmetrical during the day," he wrote. To untangle the patterns of bike-share riders, the team used weekday data from last October to create a matrix showing imbalances at every station by hour of day.
There are predictable patterns: Between 10 a.m. and midnight, stations around Union Square act as the center of much of the system's activity. Not surprisingly, Penn Station and Grand Central become hotspots during peak hours. The worst imbalances occur from 6 to 10 a.m. and again from 4 to 8 p.m., though there a handful of outlier stations that either don't experience major imbalances or see capacity problems outside those hours.
Imbalances at busier stations affect more people than imbalances at out-of-the-way stations, so the group isolated the highest-impact problem spots by creating a chart that overlays the severity of imbalances with total activity at each station by hour.
Finally, there are some stations that are surrounded by a sea of imbalanced stations, but seem to experience relatively few problems of their own. For one reason or another, something is going right at these locations. "These stations have been outlined on the maps and should be further studied," Saldarriaga wrote.
There are more maps, as well as charts and animated GIFs to see how bikes move across the Citi Bike network, at the Spatial Information Design Lab website. The data could be used to produce more than just neat maps and animations: Citi Bike is a participant in this year's Big Apps challenge, an effort led by EDC to use open data to create useful tools for New Yorkers. Now, if only there were an app to fix those broken docks.
Stay in touch
Sign up for our free newsletter
More from Streetsblog New York City
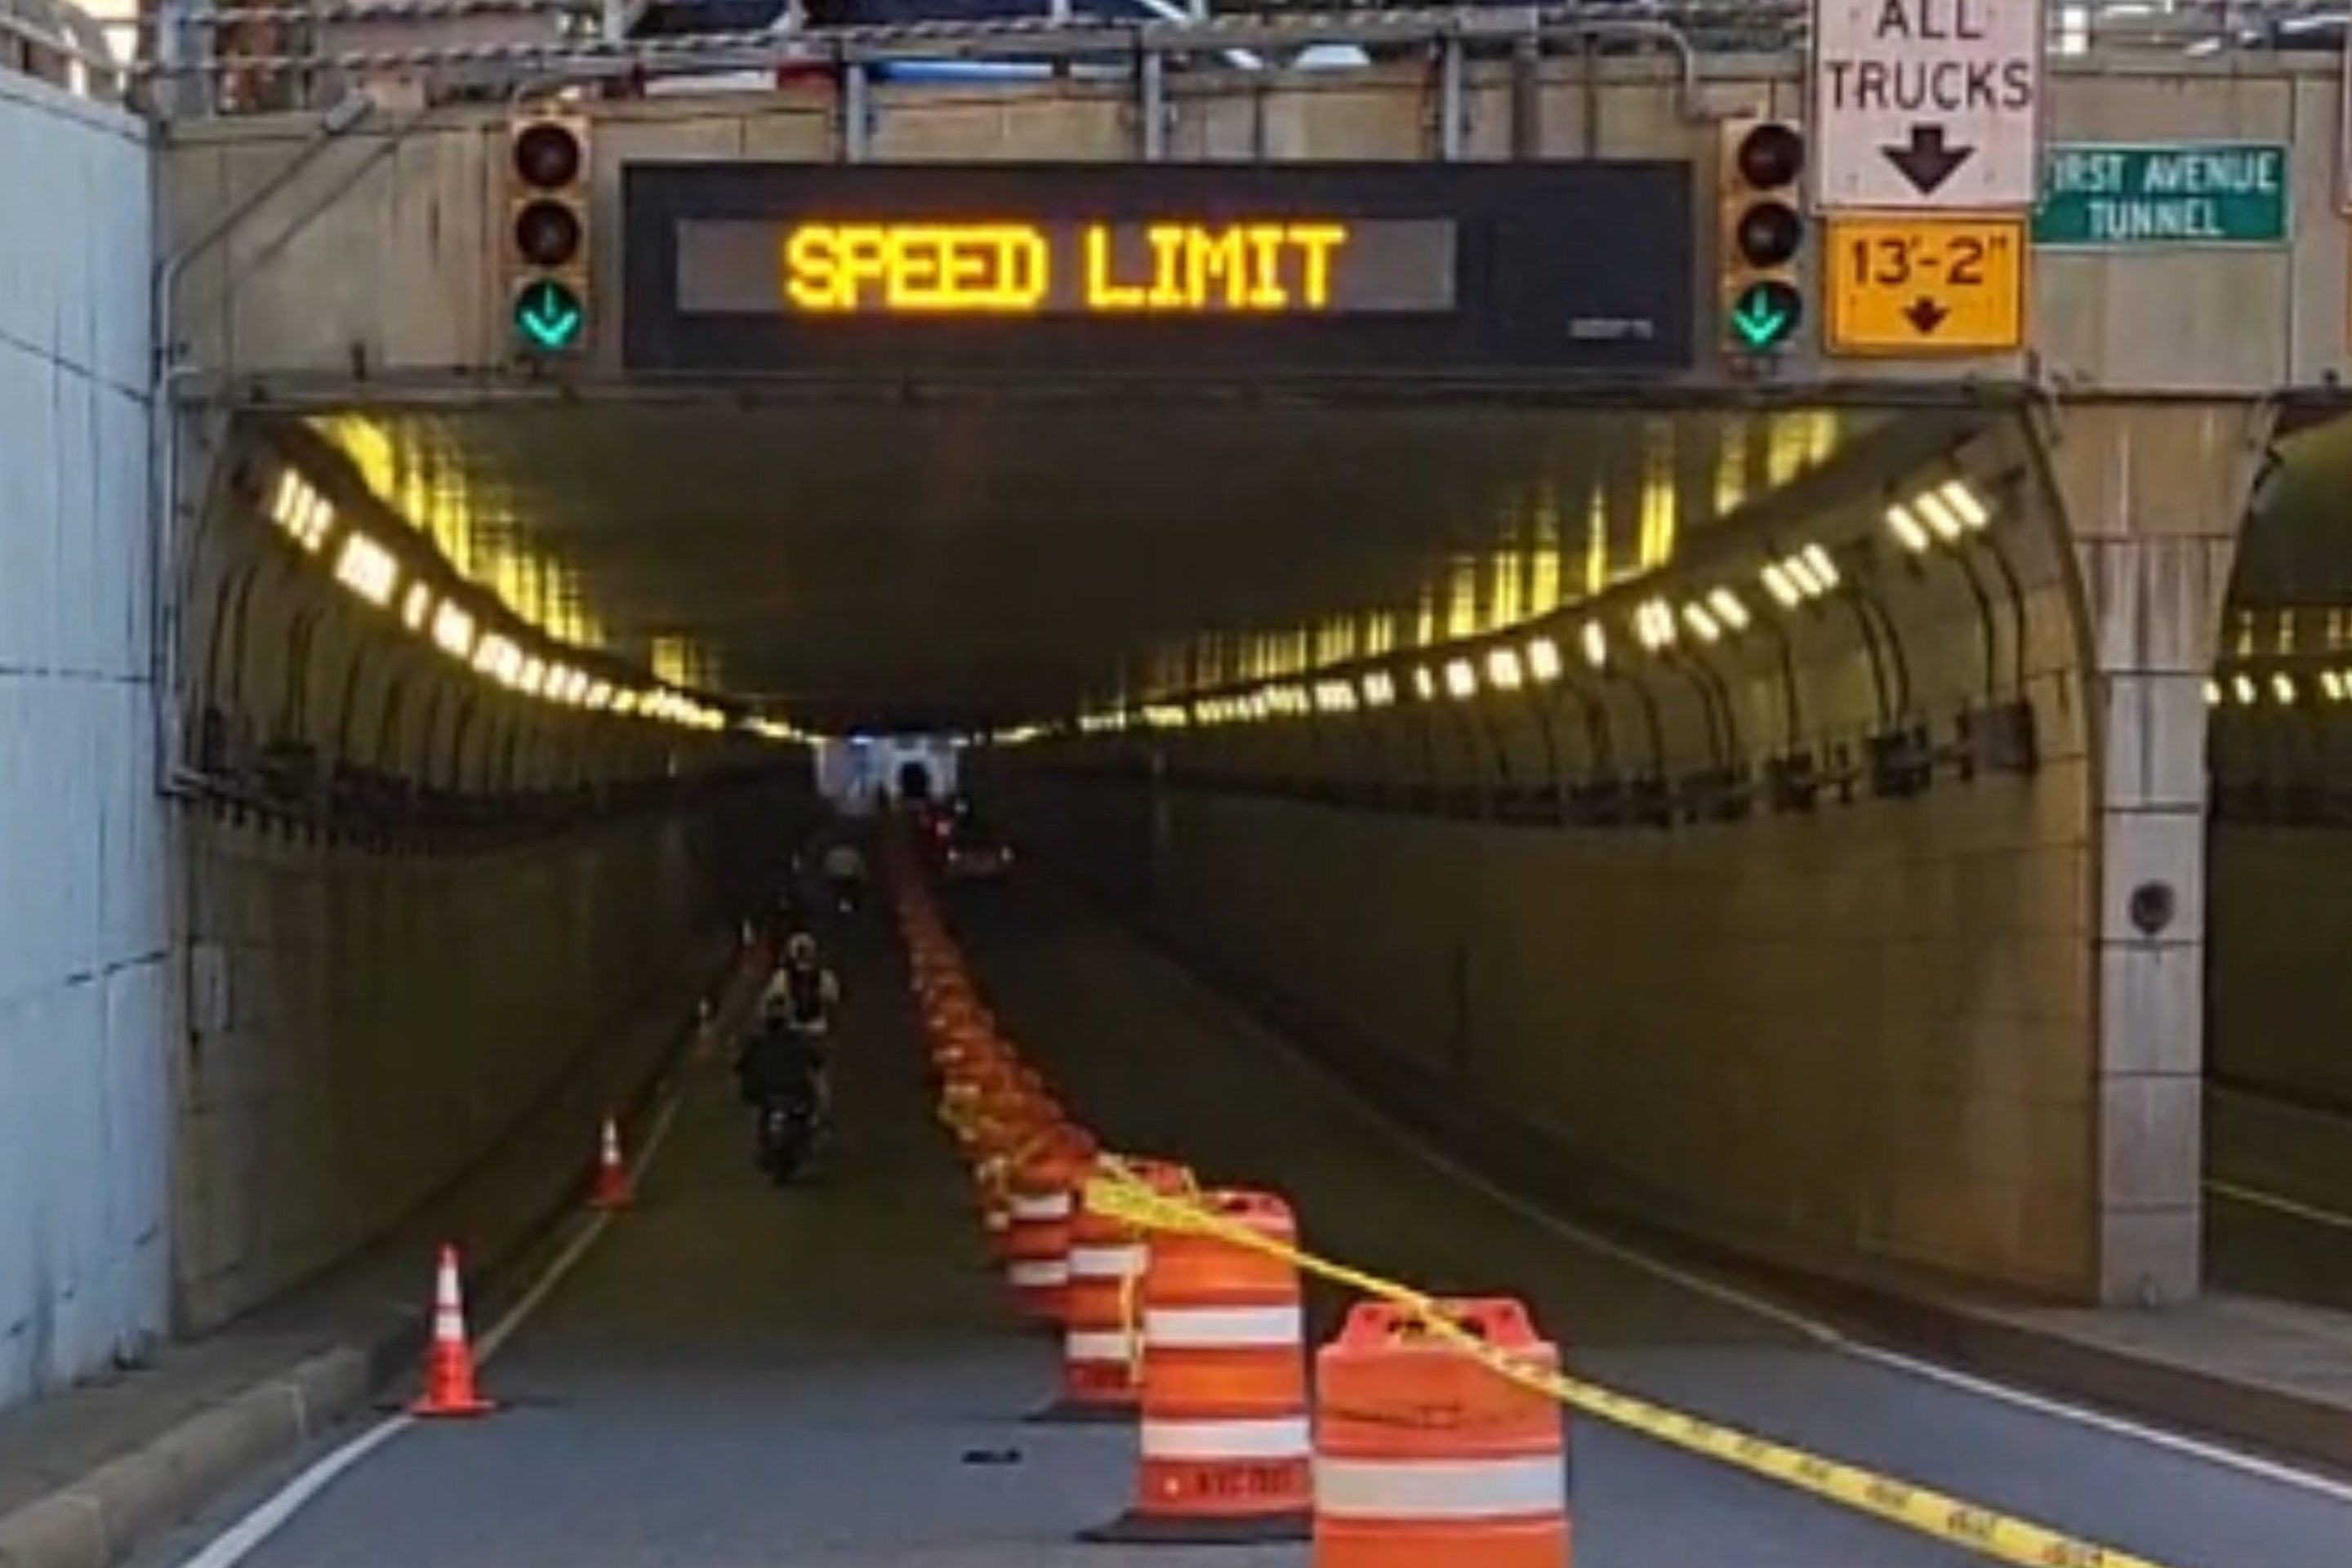
DOT Aims to Build First Ave. Tunnel Bike Lane Before September’s UN General Assembly
DOT hopes to have the concrete-protect tunnel bike lane installed this summer, but its exact plans are still in development.
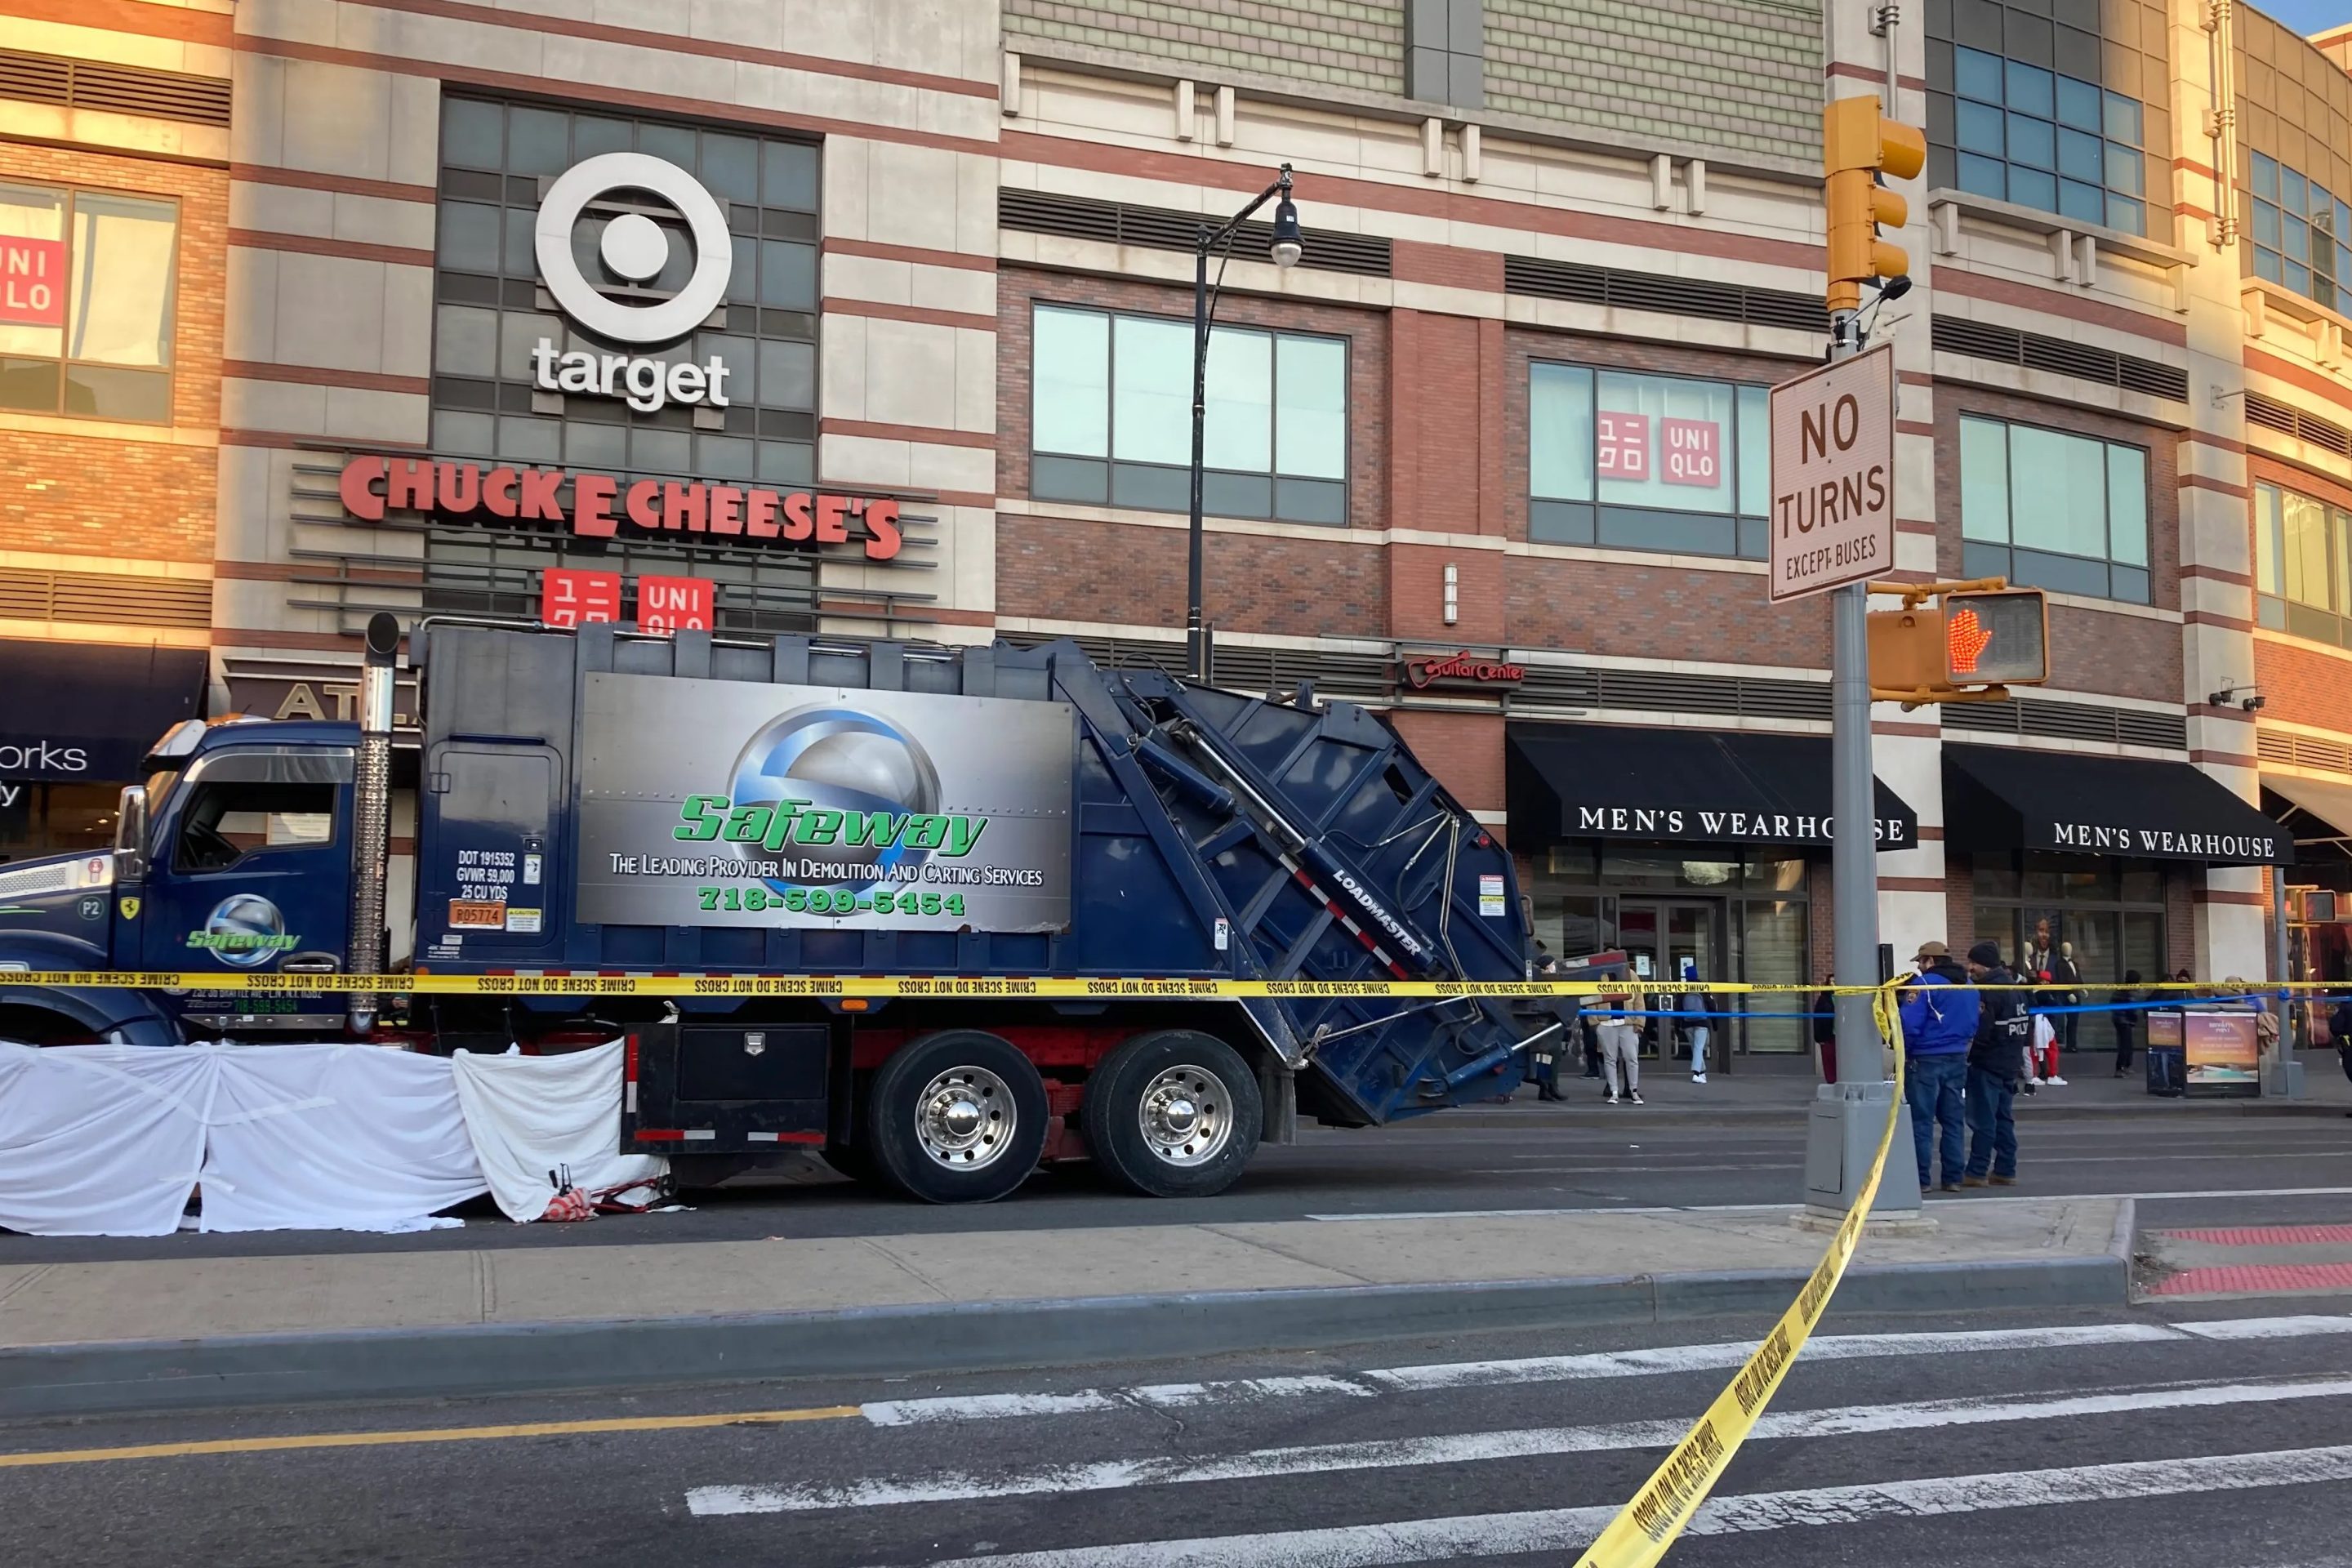
Waste Reforms Could Require Data on Crashes, Dangerous Driving
The proposal affects at least one trucking company with a deadly driving record.
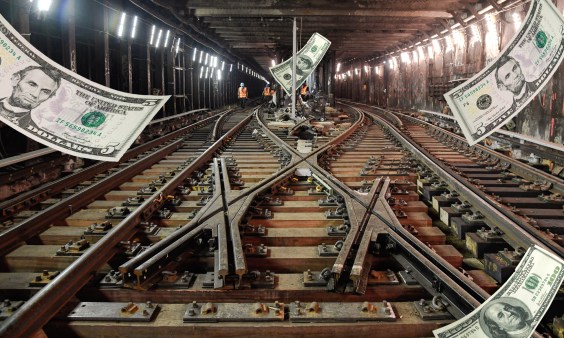
When it Comes to Federal Infrastructure Grants, Size Does Matter
Cities and municipalities with larger budgets and staff are more likely to win competitive federal infrastructure grants, the Urban Institute has found.
Tuesday’s Headlines: Real Estate Greed Against Good Bike Lane Design Edition
A real estate developer's opposition to the Ashland Place protected bike lane yields some baffling bike lane markings. Plus more news.
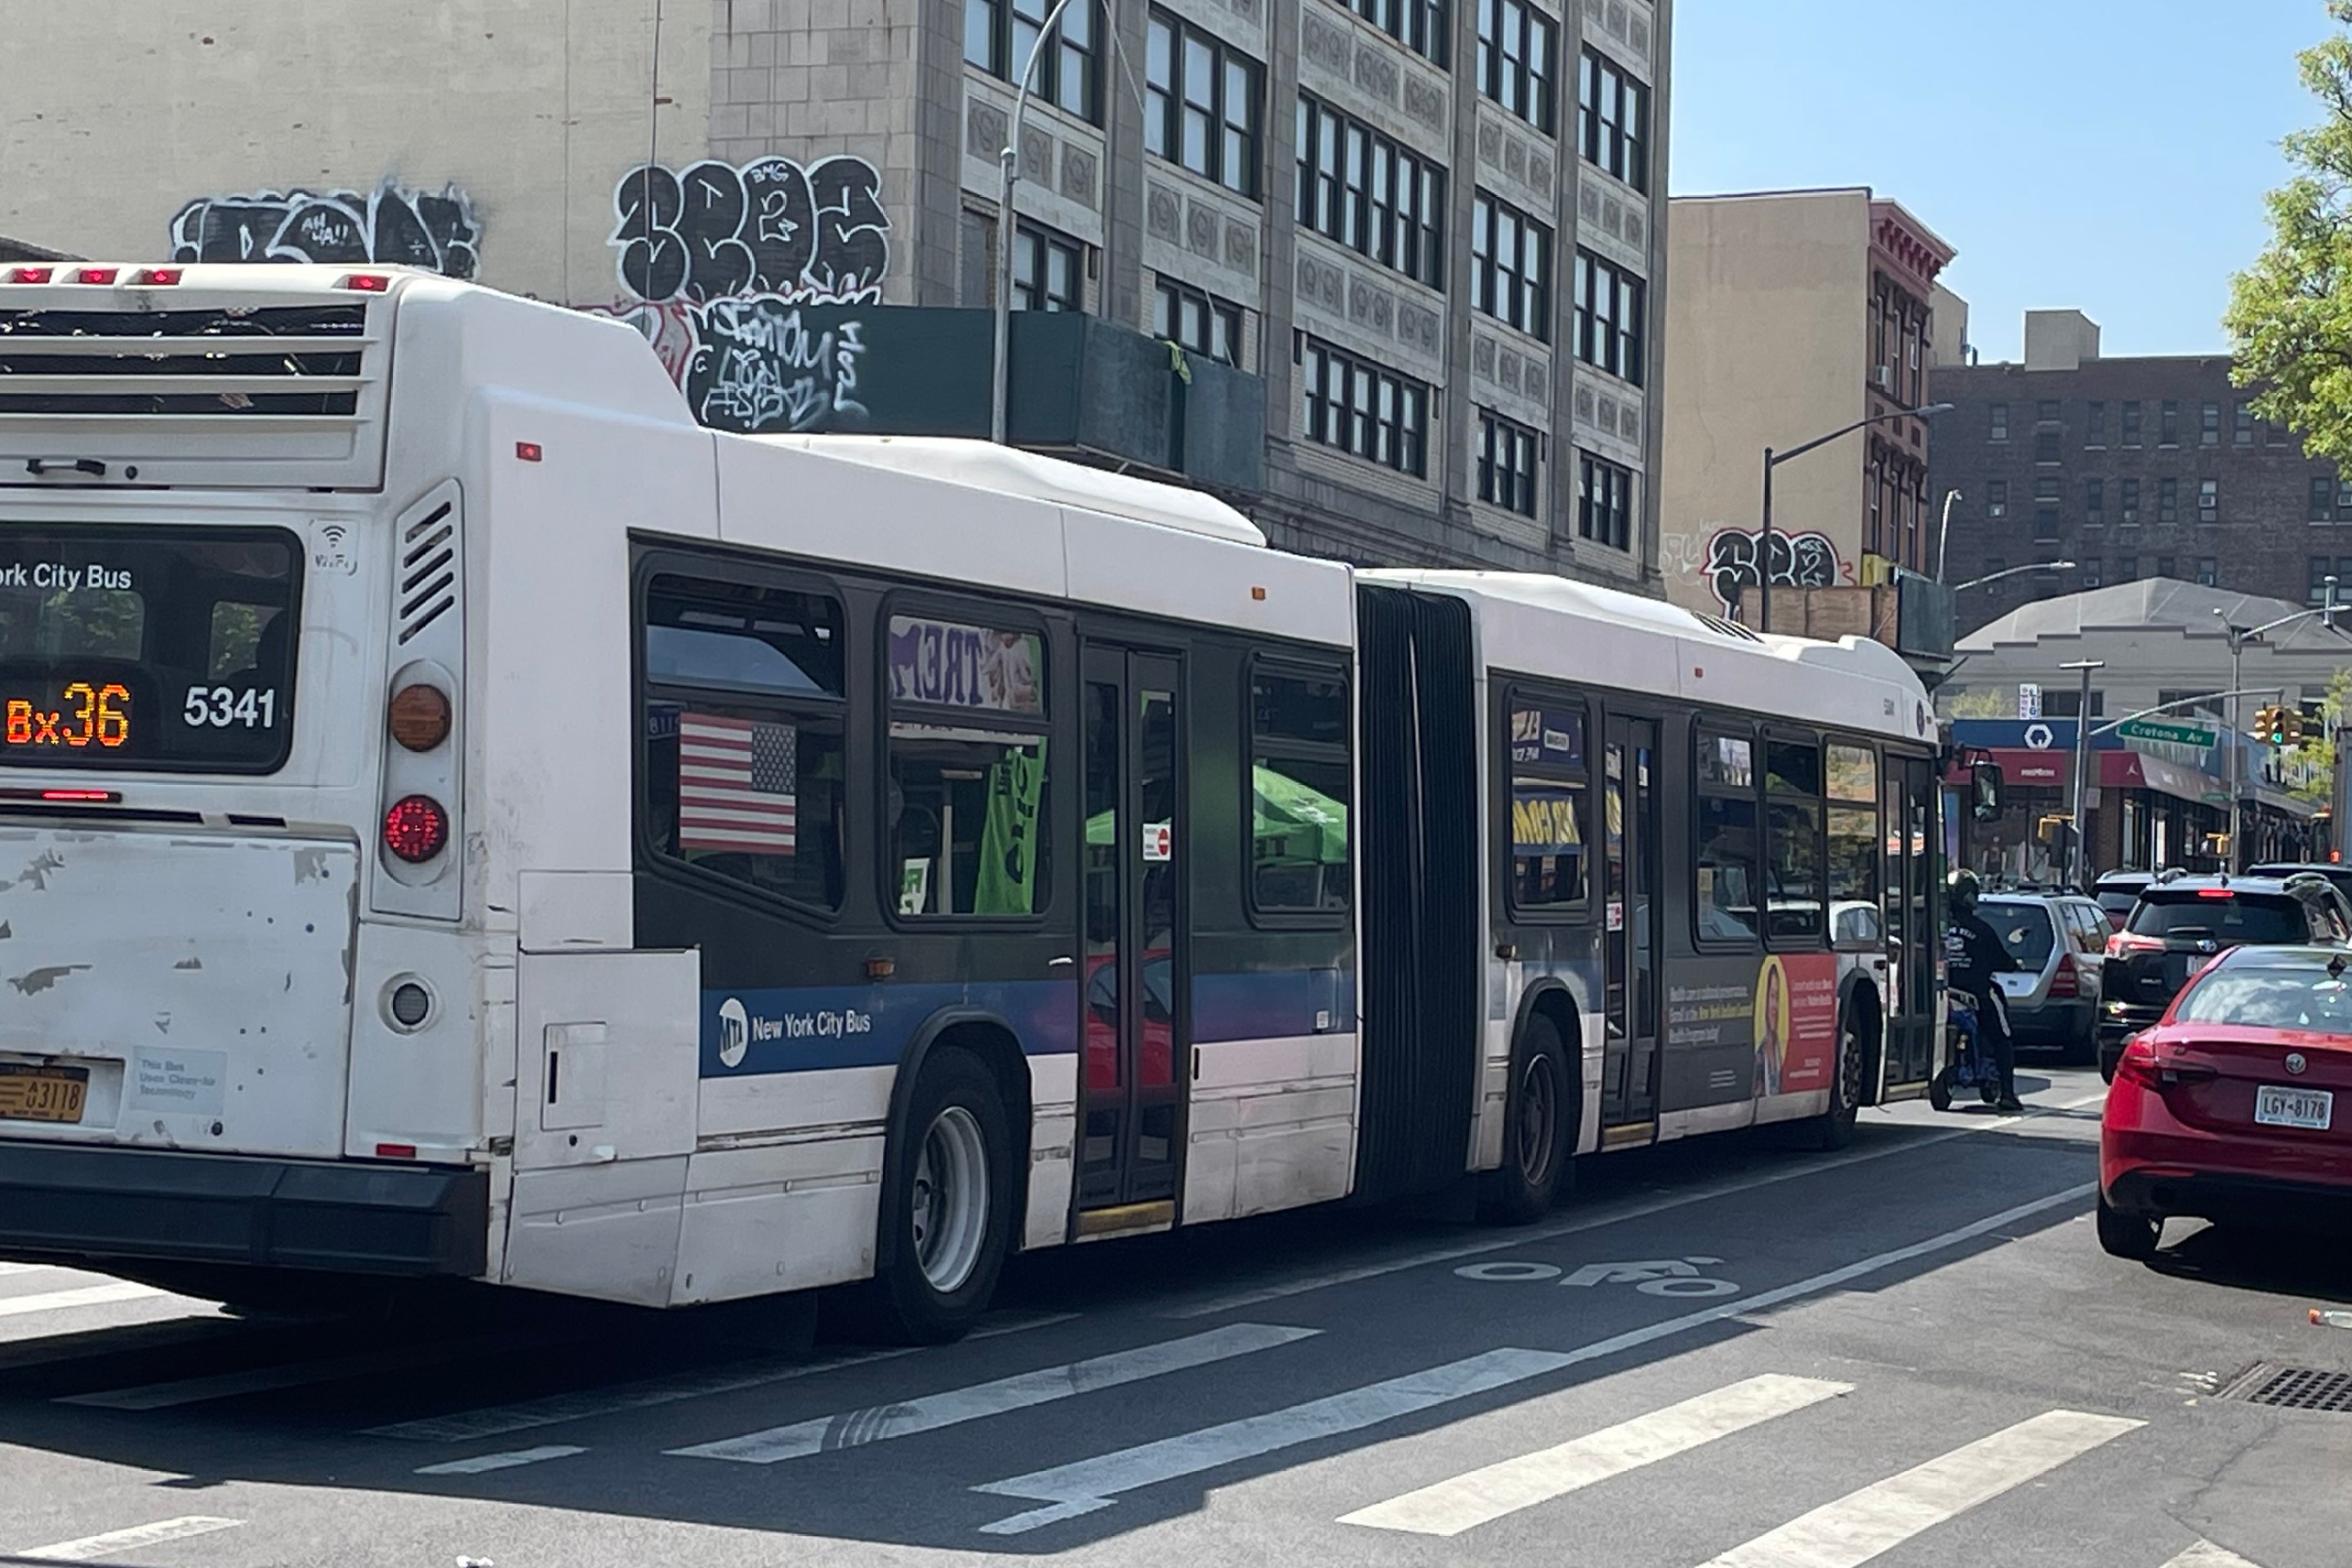
City Considers Fixes for Another Ridiculously Slow Cross-Bronx Bus
Potential bus improvements are on the table for the Bronx's Tremont Avenue, but the Adams administration's failures on nearby Fordham Road loom large.