Ray Kelly Sees Value in Mapping Car Thefts, But Not Car Crashes

A couple of months ago, NYPD brass told the City Council that it would be useless for the department to map where people are being killed and injured by motorists. On the other hand, Commissioner Ray Kelly believes the public will benefit from knowing where cars are being stolen.
The council succeeded this week in prodding NYPD to produce an interactive map of seven types of felony crimes: murder, rape, felony assault, burglary, grand larceny, and grand larceny of a motor vehicle. While NYPD has for years refused to acknowledge the value of crash data in helping citizens and advocates understand where streets are most dangerous, Kelly touted the felony map as an important crime-fighting and communications tool.
"With unprecedented population levels, New York City is safer than ever, with homicides on pace this year to fall below recent historic lows," Kelly said in a statement. "This administration has relied on data to drive its crimefighting, and this map helps enhance New Yorkers’ and researchers’ understanding of where felony and violent crime persists."
Back in October, Susan Petito, NYPD assistant commissioner of intergovernmental affairs, said that mapping crashes would only confuse the public, since data are derived from reports that site crashes based on the nearest intersection. And when asked if NYPD would join the council in trying to get the state crash report form changed to allow for addresses or geographic coordinates, Petito said, "I don’t think so. The utility of a street address, I can’t sit here and tell you that would add anything."
That hearing was the latest episode in a long battle to wrest traffic crash information from NYPD, which the department has historically guarded as if it were a matter of national security.
After the City Council passed a law requiring NYPD to make crash data available to the public, the department initially limited its availability to a series of PDF files. Last year, Petito told the council NYPD believed data released on spreadsheets could be manipulated by people who want “to make a point of some sort.” While the department has since begun publishing crash data in spreadsheet form, NYPD hasn't mapped it to make the information broadly accessible. (Some enterprising developers, however, have done it on their own time.)
NYPD's approach to these two types of data encapsulates Ray Kelly's blind spot for traffic violence: The police are pleased to show people where they should take extra precautions to preserve their cars, but not where they need to advocate for greater protection from dangerous driving.

Stay in touch
Sign up for our free newsletter
More from Streetsblog New York City
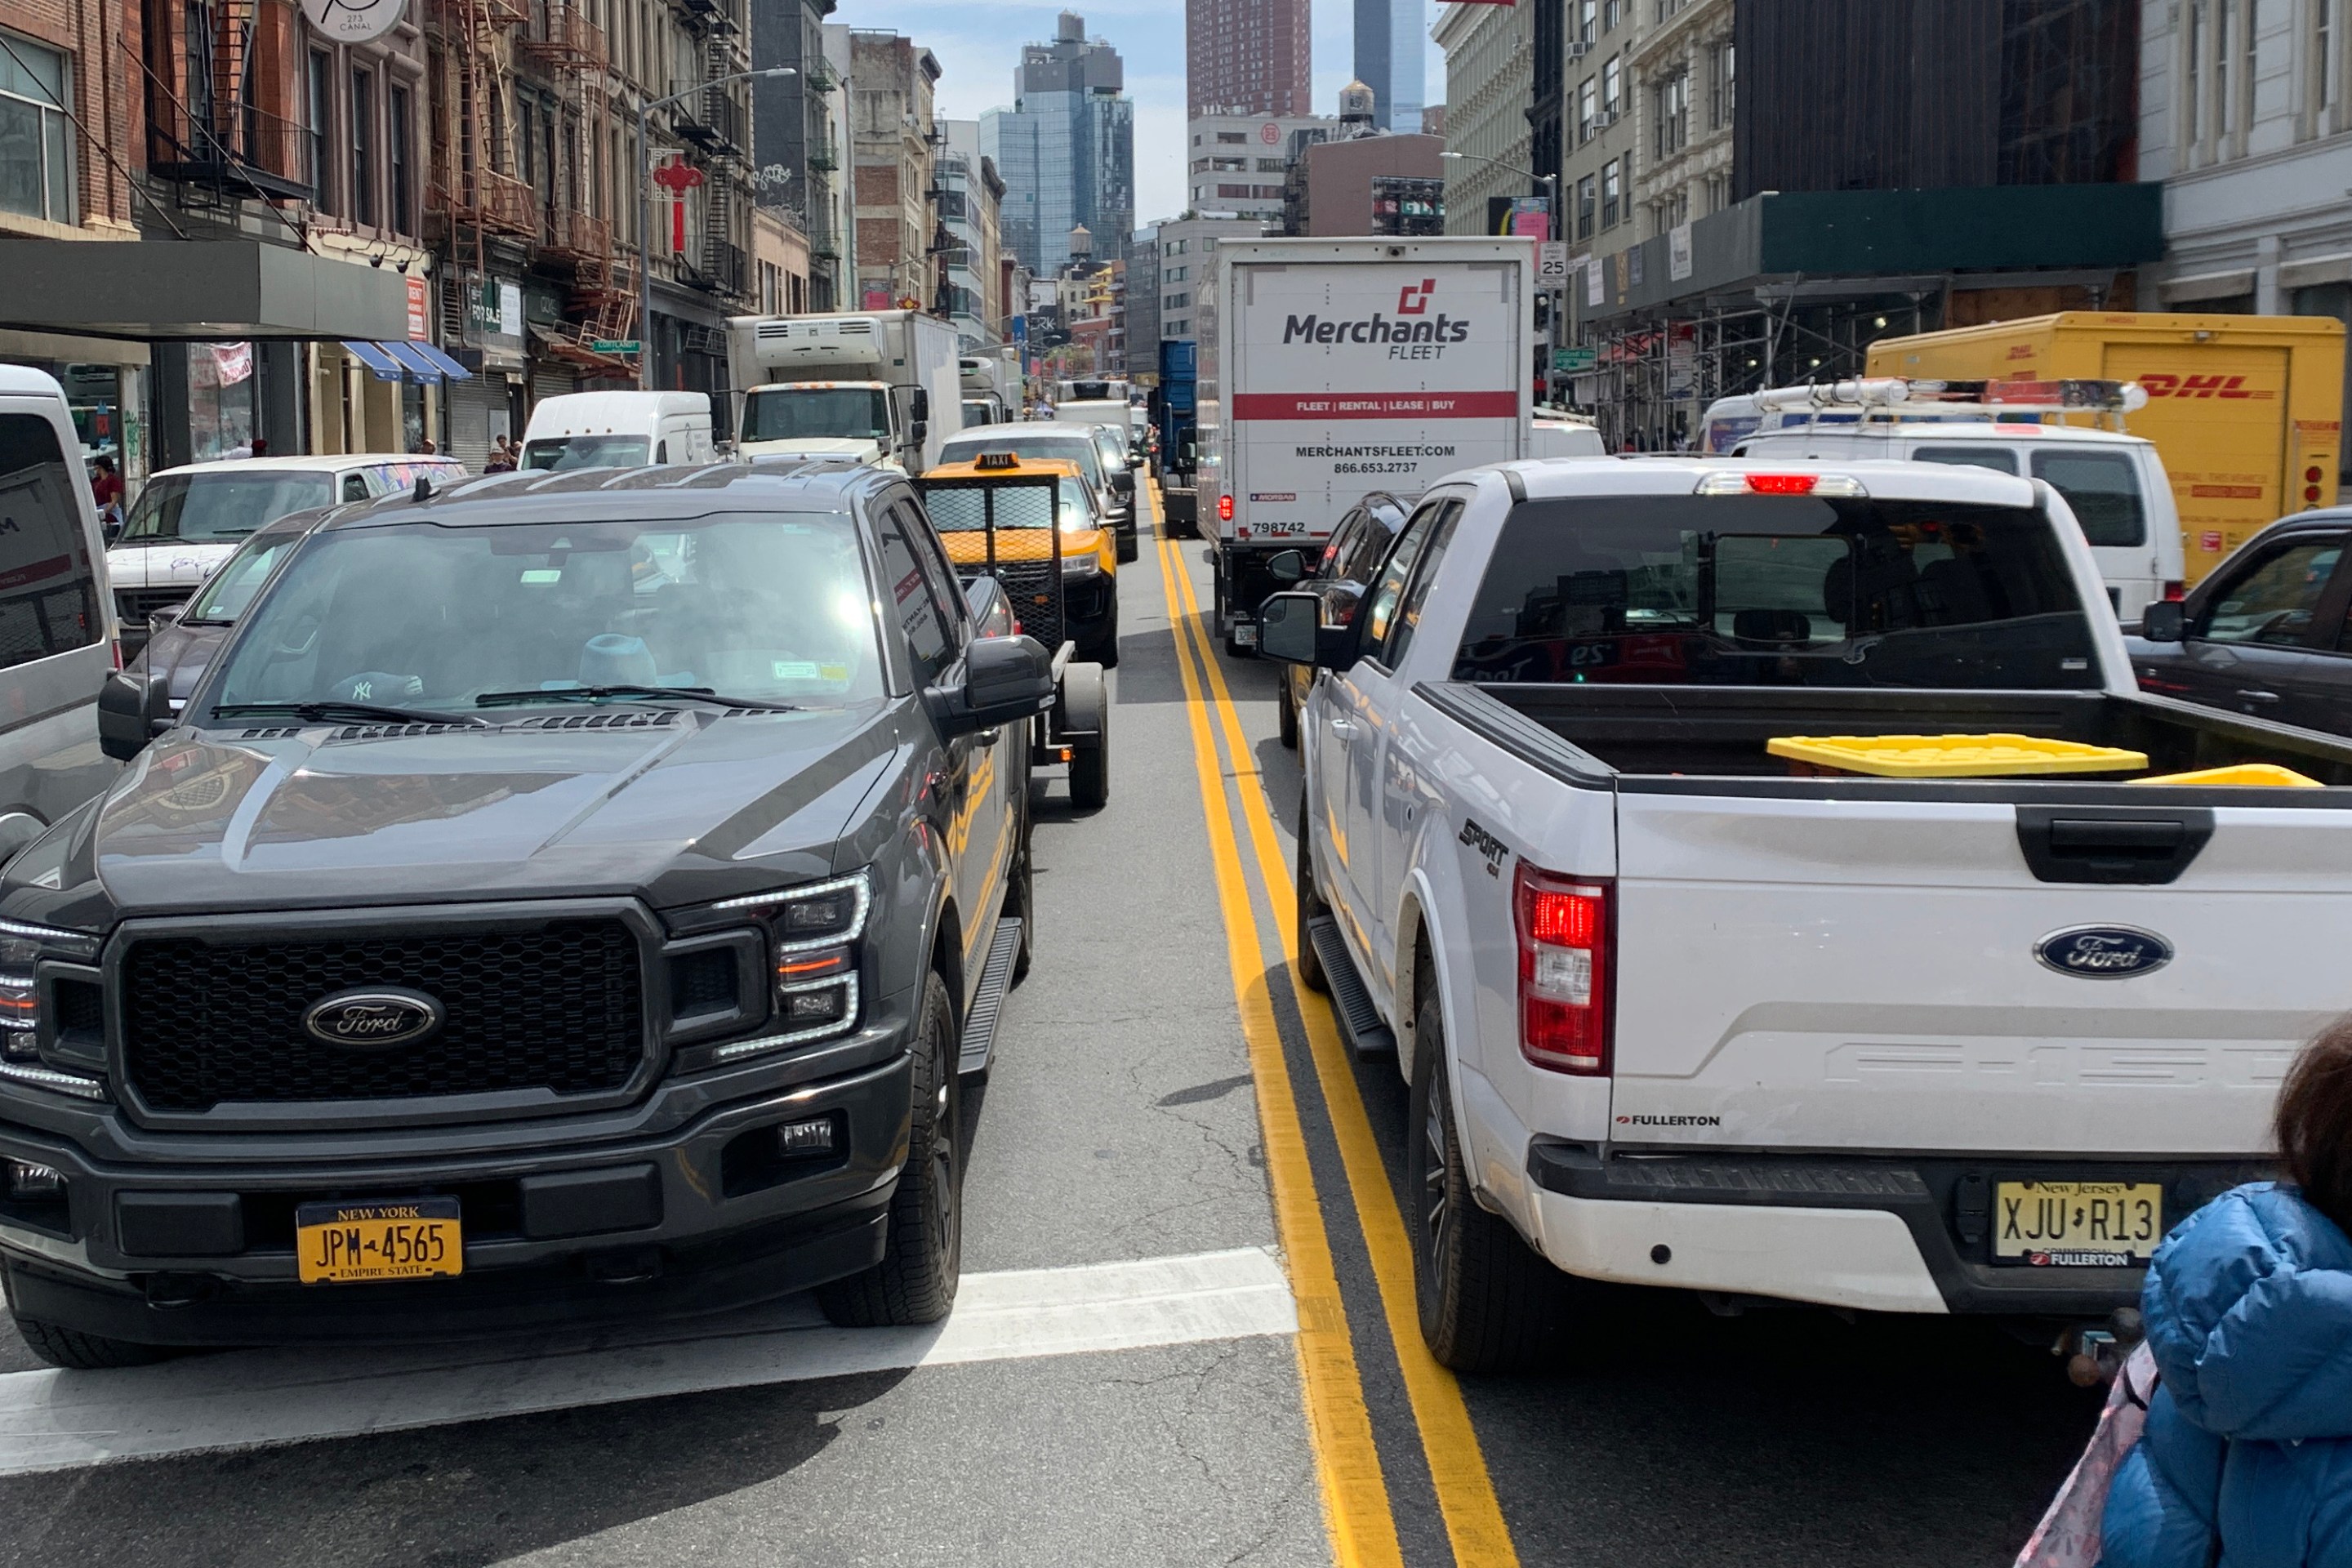
Friday’s Headlines: Canal Street Follies Edition
Manhattan Borough President Mark Levine isn't happy. Plus otherness.
Daylight Again: Bronx Community Board Backs Parking Ban at Intersections
The Boogie Down is down with daylighting!
Community Board Wants Protected Bike Lane on Empire Blvd.
Brooklyn Community Board 9 wants city to upgrade Empire Boulevard's frequently blocked bike lane, which serves as a gateway to Prospect Park.
The Brake: Why We Can’t End Violence on Transit With More Police
Are more cops the answer to violence against transit workers, or is it only driving societal tensions that make attacks more frequent?
Report: Road Violence Hits Record in First Quarter of 2024
Sixty people died in the first three months of the year, 50 percent more than the first quarter of 2018, which was the safest opening three months of any Vision Zero year.