DCP Report Adds Another Wrinkle to Measurements of NYC Cycling
 The number of cyclists on the Second Avenue bike lane, at 7th Street, has been on the rise. Image: DCP
More New Yorkers are riding bikes than ever, but a new report from the Department of City Planning further complicates the effort to precisely determine how much cycling has taken off. The report, which looks only at cycling in Manhattan bike lanes from 2001 to 2008, shows a significantly slower rate of growth than estimates based on other measurements.
To develop its report, DCP tracked the number of cyclists using ten on-street bike lanes and seven points along the greenway system over the course of a fall day. From 2001 to 2008, use of the on-street lanes increased by 30 percent. Along the greenways, the number of cyclists grew by 26 percent from 2002 to 2008. The report was completed in June 2009 but didn't appear online until this summer.
The observed growth in use of Manhattan bike routes is far below other estimates of cycling citywide. Commuter cycling increased 150 percent between 2001 and 2008, according to measurements by NYCDOT [PDF]. The U.S. Census, too, recorded a faster increase based on interviews through its American Community Survey. "Although the American Community Survey has been criticized for underestimating the growth in cycling in New York City," said Rutgers professor John Pucher, "its growth rate is twice as high as the rate estimated by DCP."
Of course, each of these data sets captures different information. DCP looked at older bike lanes along the length of Manhattan, many of which are not up to present-day standards. DOT's count captures cyclist volumes from April to October and is largely based on the number of cyclists crossing the East River bridges, which connect neighborhoods with some of the largest concentrations of cyclists and with well-developed bike infrastructure. ACS data covers the entire city, but only counts those who use the bike as their primary mode of commuting, erasing those who bike part-time, or for local errands.
A DCP spokesperson said that although different methodologies yield different results, the important thing is that cycling is up in New York City. Moreover, she noted, the report adds yet more evidence that installing bike facilities increases ridership, a fact which she said will inform the department's bike planning efforts.
Transportation Alternatives' Noah Budnick said the disparities between estimates of cycling growth highlight the fact that "data has never really been collected on cycling, and people are still trying to figure out how to do it." He also emphasized that the absolute number of cyclists on the greenways was significantly higher than on parallel on-street lanes. "Cyclists really love protected space," he said.
In addition to the counts on specific corridors, DCP's study sheds some light on who uses Manhattan's bike lanes, where, and how. Over the whole period studied, for example, there were six times as many men using on-street bike lanes as women. But the gender split has been declining every year since 2003, and is far smaller on the greenways, where around one third of riders are women.
"The rising percentage of women cyclists in NYC is encouraging, but it's still a long way toward the 50/50 gender split among cyclists in Germany, Denmark, and the Netherlands," said Pucher. "The DOT policy of improving cycling facilities and providing greater separation from motor vehicle traffic is definitely the right policy for encouraging more cycling by all groups."
 Sidewalk riding and wrong way cycling were much more common at Adam Clayton Powell and 113th Street in 2001 than in 2008. Graphic: DCP
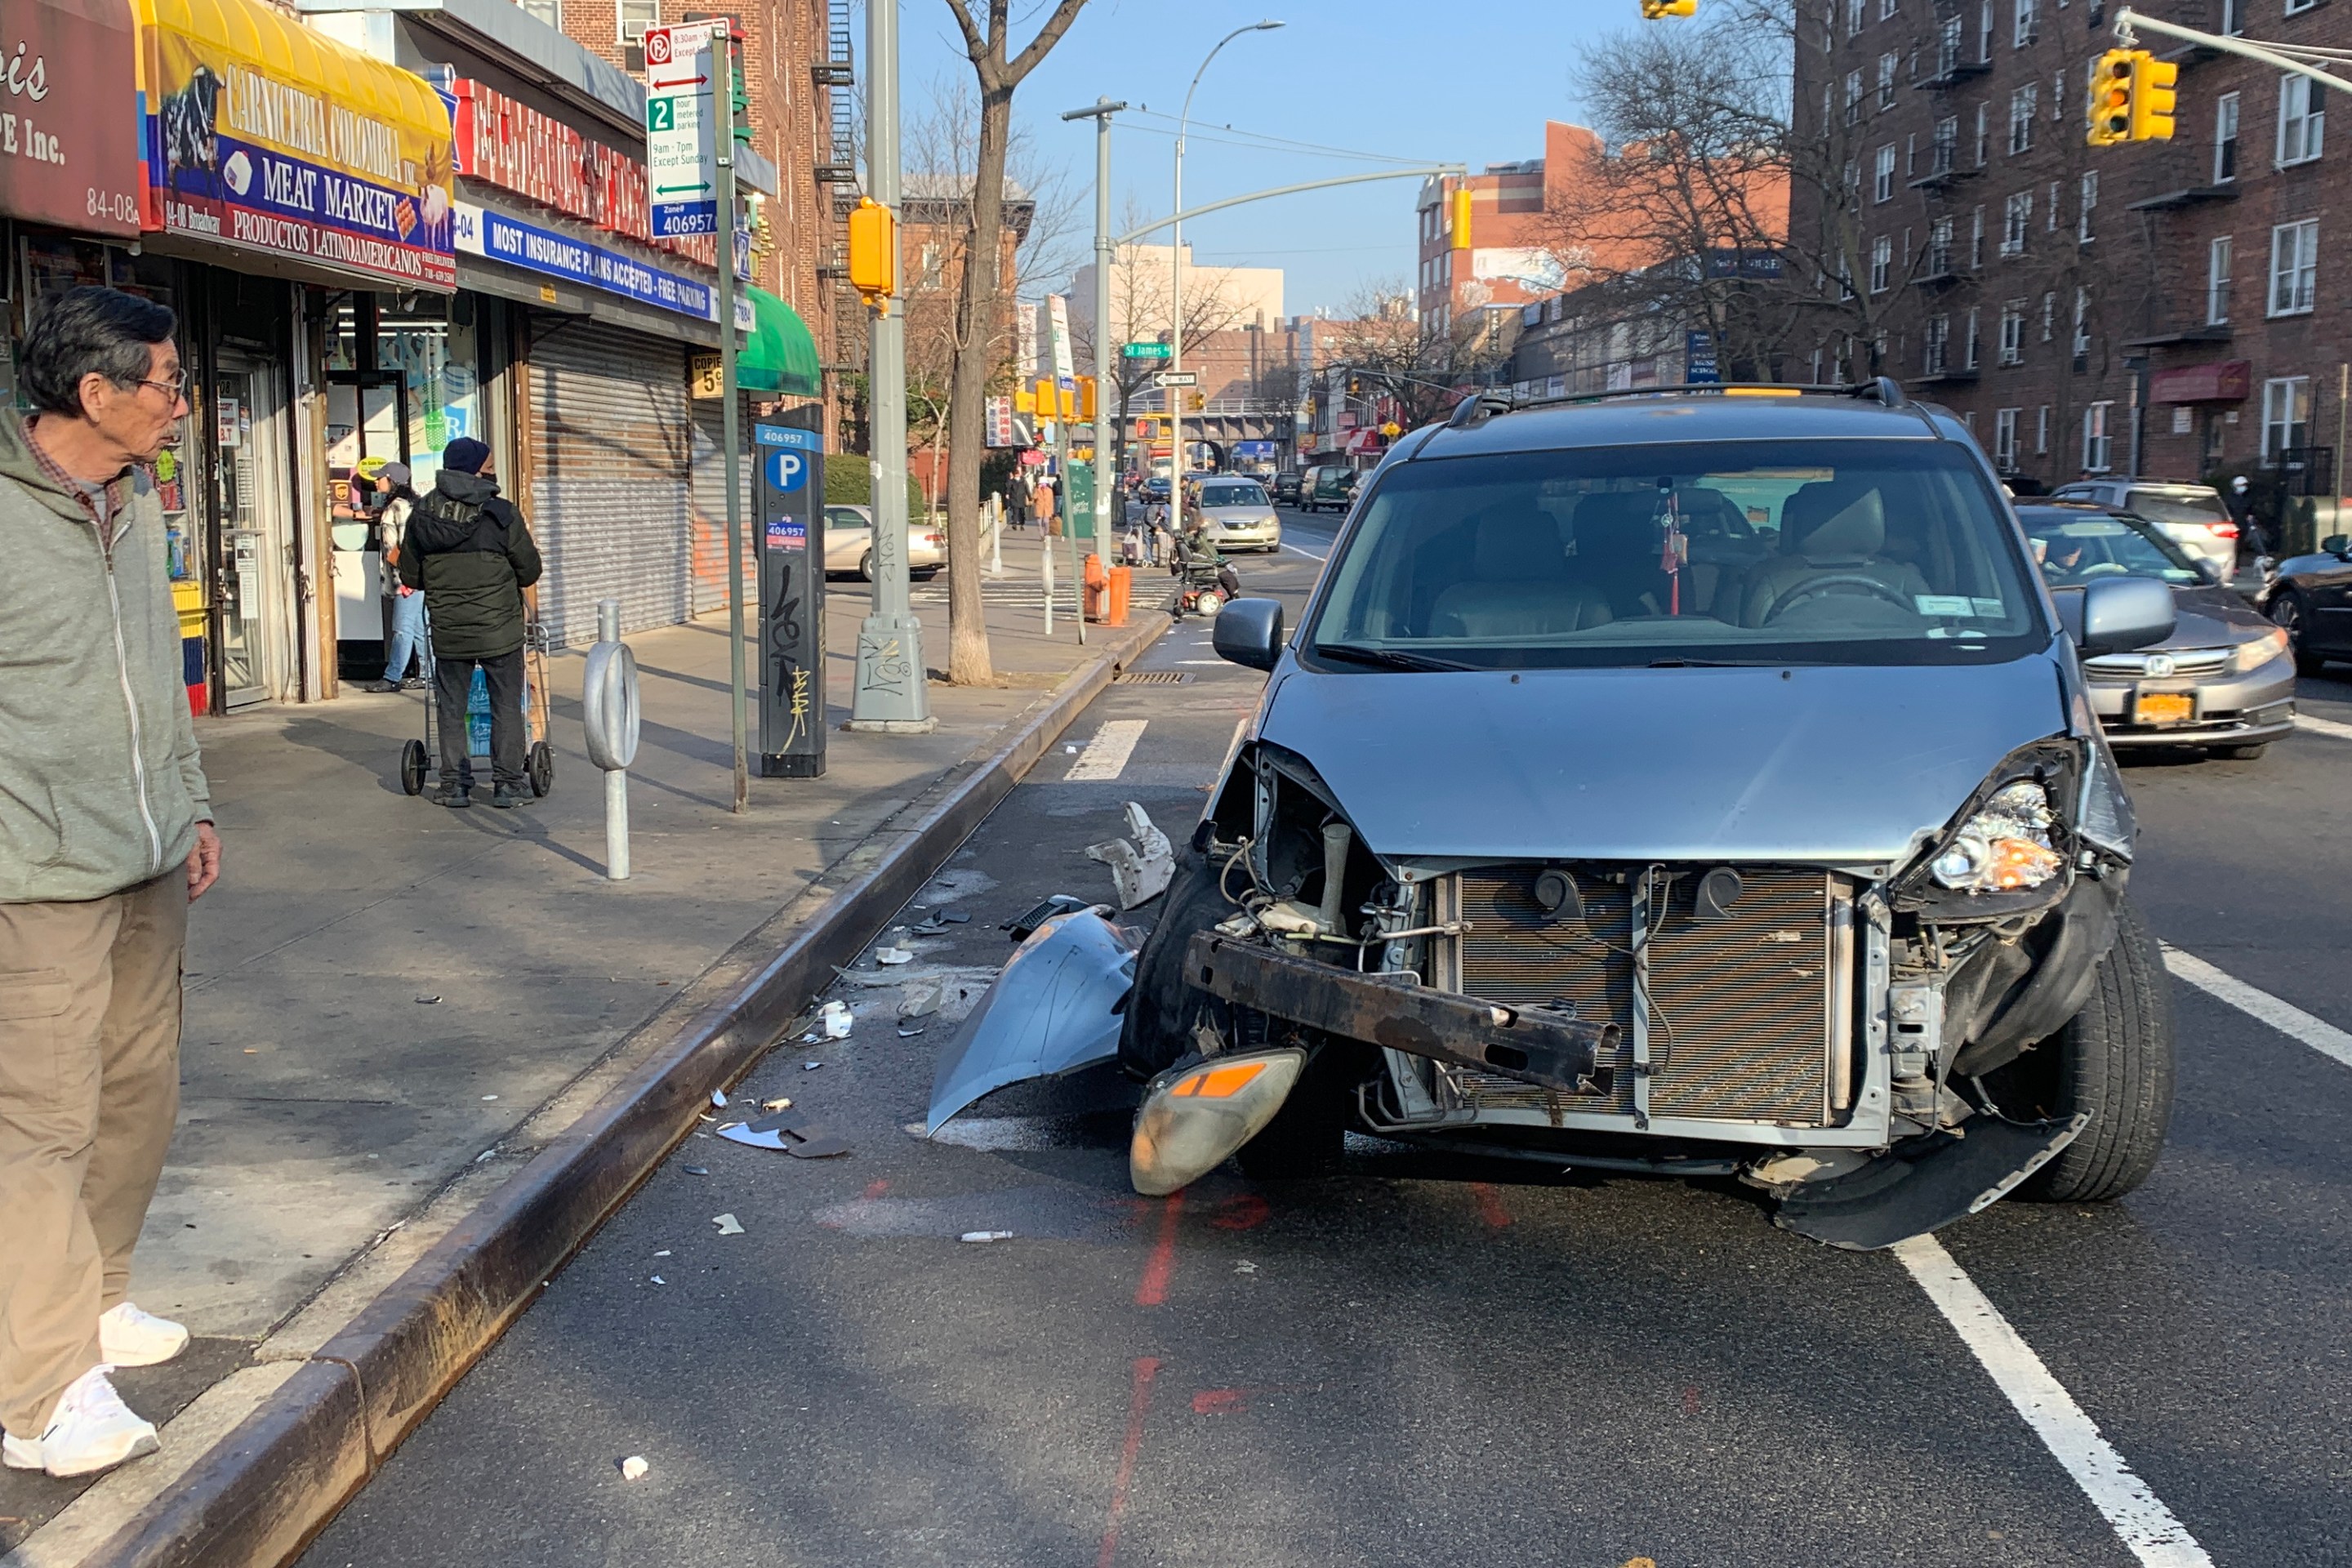
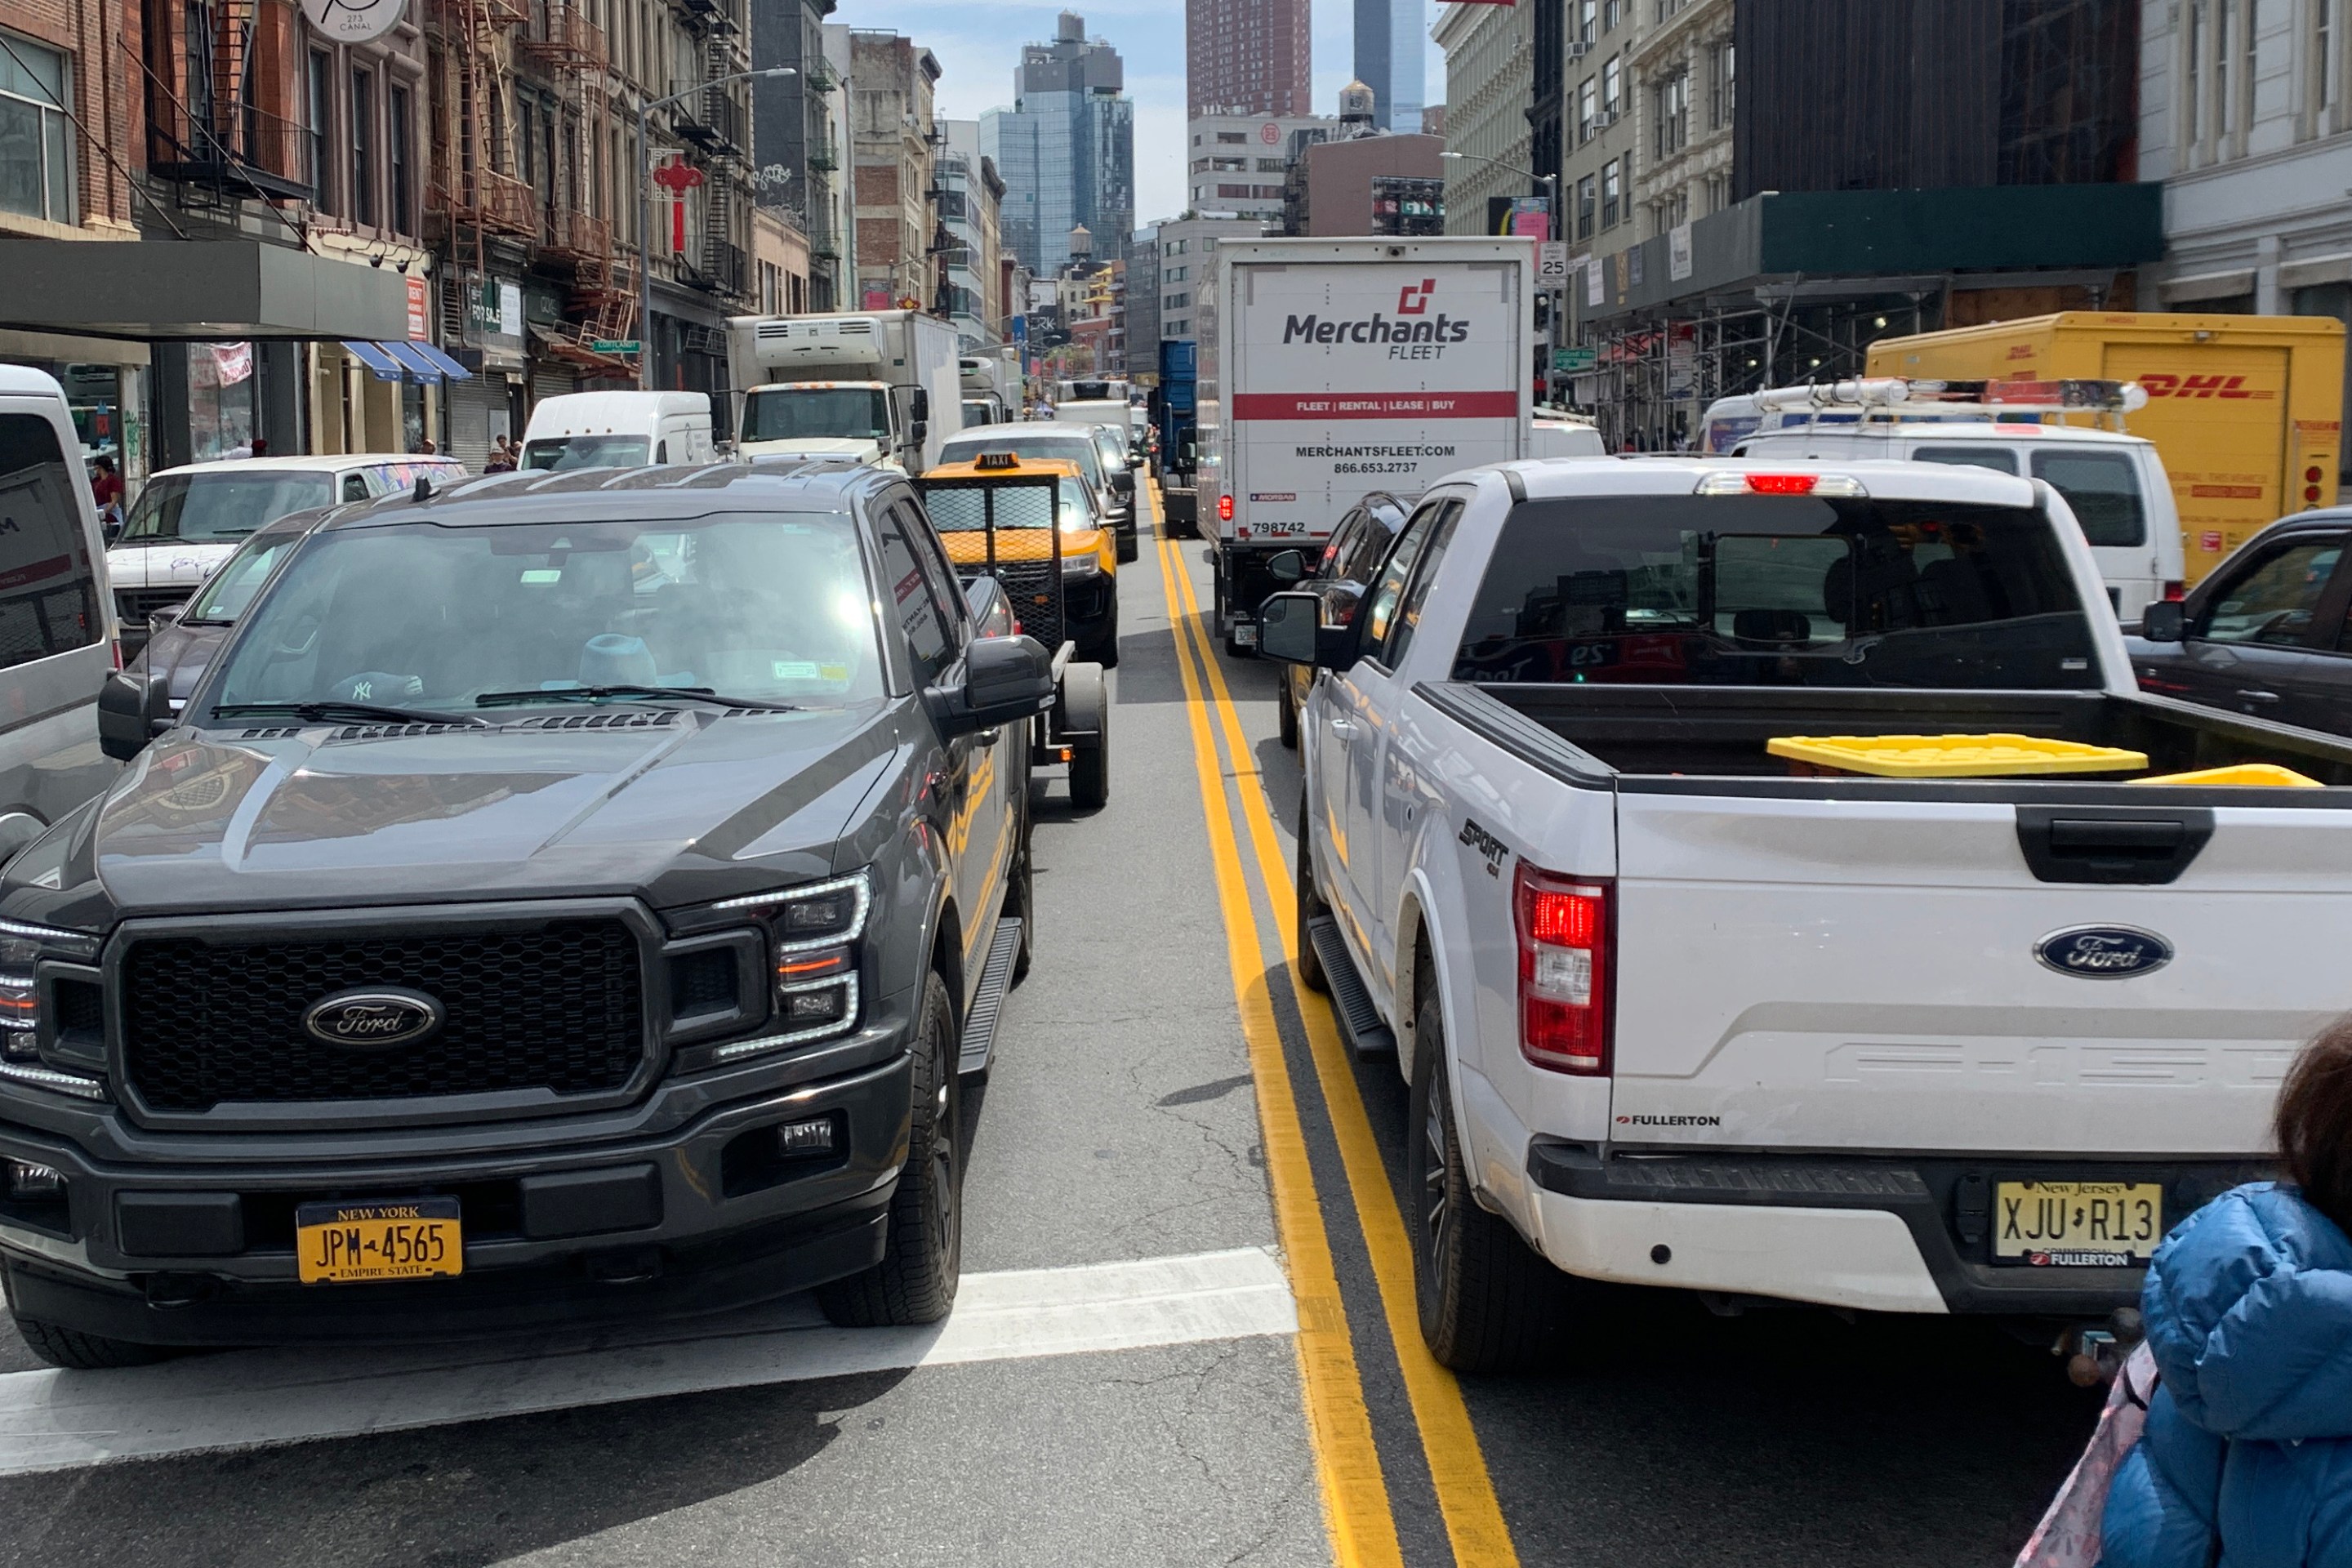
DCP's data also reveal the anarchy on many New York City streets. Unprotected bike lanes were repeatedly obstructed; nearly a full page of the report is dedicated to listing the variety of vehicles blocking the Broadway bike lane.
As for cyclist behavior, the frequency of riding against the flow of traffic varied from two to 11 percent on different corridors over course of the study, with salmon being more common in buffered lanes. During the study period, the overall number of cyclists observed riding on the sidewalk declined from 3.6 percent to 2.6 percent. The reduction in conflict between cyclists and pedestrians may also be attributed to better bike infrastructure. Riding on the sidewalk dropped by 84 percent on both Ninth Avenue and Grand Street after the installation of protected bike lanes, according to DOT statistics.
Stay in touch
Sign up for our free newsletter
More from Streetsblog New York City
Friday’s Headlines: Canal Street Follies Edition
Manhattan Borough President Mark Levine isn't happy. Plus otherness.
Daylight Again: Bronx Community Board Backs Parking Ban at Intersections
The Boogie Down is down with daylighting!
Community Board Wants Protected Bike Lane on Empire Blvd.
Brooklyn Community Board 9 wants city to upgrade Empire Boulevard's frequently blocked bike lane, which serves as a gateway to Prospect Park.
The Brake: Why We Can’t End Violence on Transit With More Police
Are more cops the answer to violence against transit workers, or is it only driving societal tensions that make attacks more frequent?
Report: Road Violence Hits Record in First Quarter of 2024
Sixty people died in the first three months of the year, 50 percent more than the first quarter of 2018, which was the safest opening three months of any Vision Zero year.