A Snapshot of New York City Gridlock
Bruce Schaller's new study, Battling Traffic, released this morning at a standing-room only Manhattan Institute panel discussion, digs in to the question of what New Yorkers really think about the city's traffic congestion and the idea of using road pricing and other tools to manage it. Want to see what New York City gridlock looks like? Take a look at this remarkable map from Schaller's study:
Evening "Rush Hour" Visualized: Average traffic speeds from 4:00 to 8:00 pm

Key: Average peak direction driving speeds during the evening "rush hour."
Red: Under 6 mph
Pink: 6 to 10 mph
Gray: Over 10 mph
Stay in touch
Sign up for our free newsletter
More from Streetsblog New York City
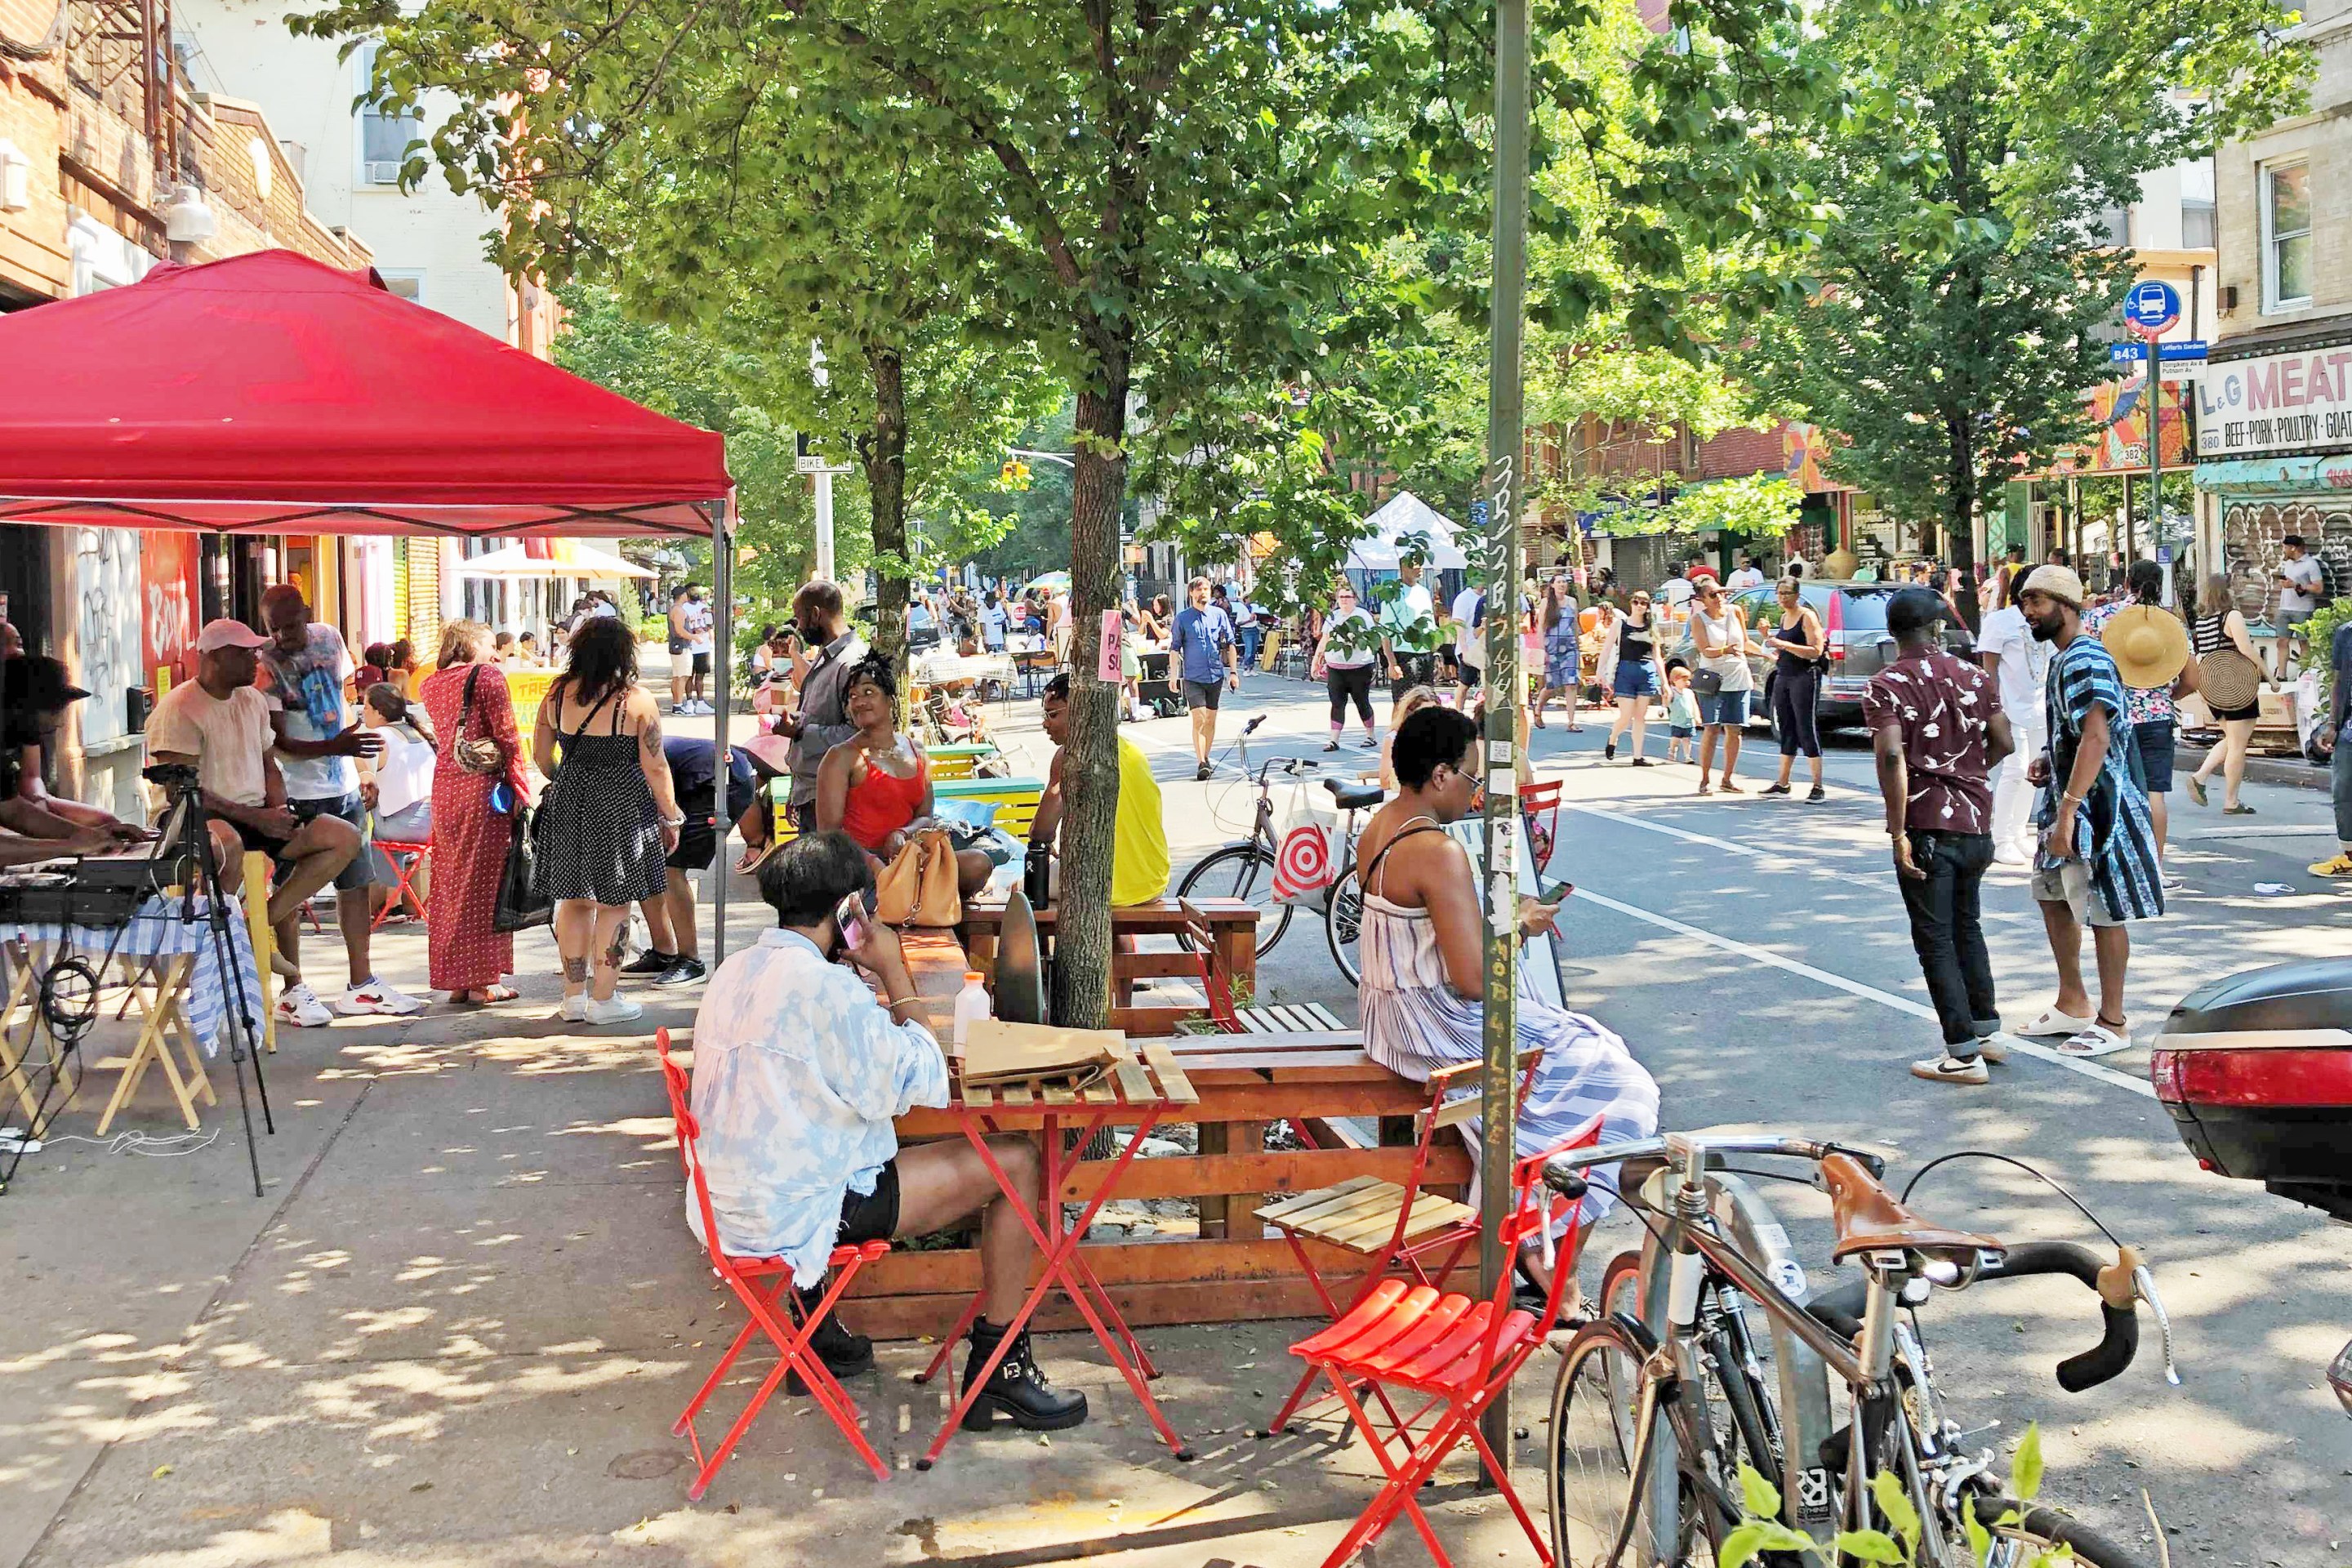
Wednesday’s Headlines: Four for Fifth Edition
The good news? There's a new operator for the Fifth Avenue open street. The bad news? It's four blocks, down from 15 last year. Plus other news.
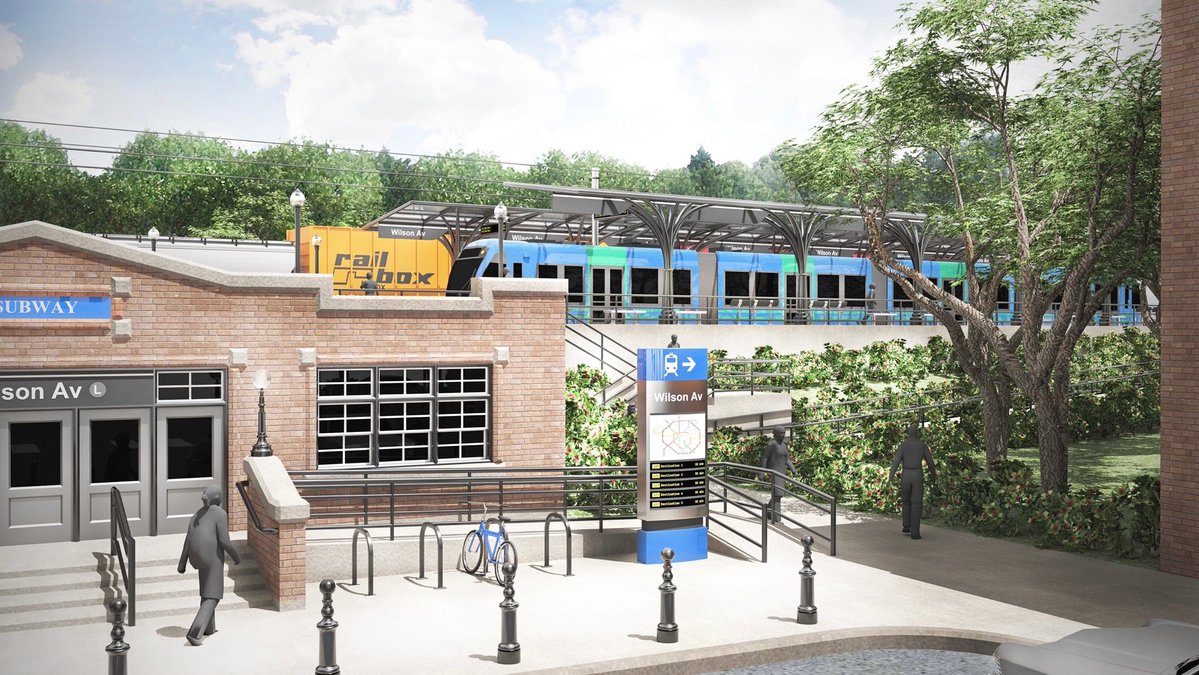
MTA Plan to Run Brooklyn-Queens Train on City Streets a ‘Grave’ Mistake: Advocates
A 515-foot tunnel beneath All Faiths Cemetery would slightly increase the cost of the project in exchange for "enormous" service benefits, a new report argues.
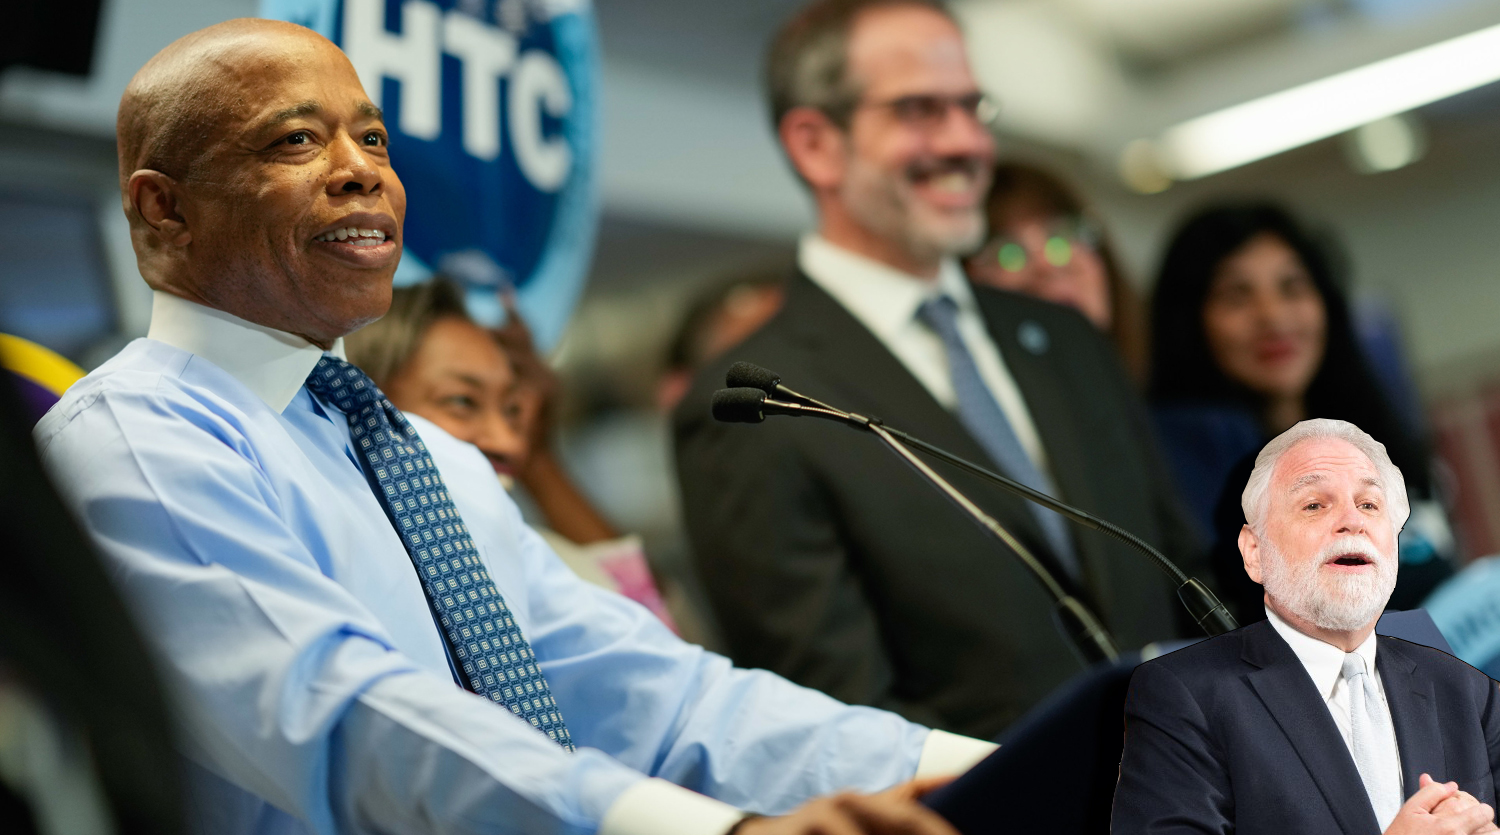
Full Court Press by Mayor for Congestion Pricing Foe Randy Mastro
Pay no attention to that lawyer behind the curtain fighting for New Jersey, the mayor's team said on Tuesday, channeling the Wizard of Oz.
Tuesday’s Headlines: Valley of Political Death Edition
Did you see the new poll showing congestion pricing is really unpopular? Ignore it! Good times are coming. Plus other news in today's headlines.
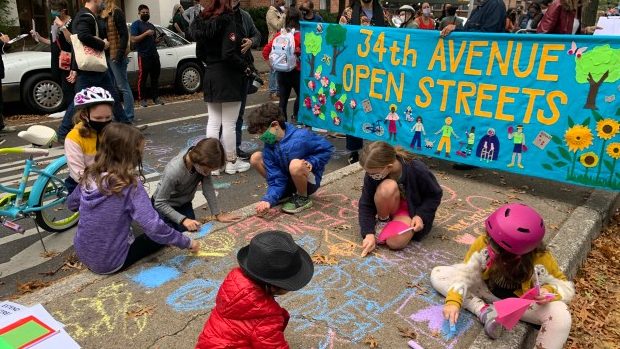
Open Streets Groups Warn of Extra Red Tape to Run Events
Two weeks notice for hopscotch or a yoga class?